The Solana price analysis for today shows a mixed market sentiment. The crypto surged to a high of $83 but found it difficult to break past this level. Prices have retraced to $81 but the market looks positive as bulls seek to push prices back up. The prices seem to be alternating between the $81 and $83 levels and it does not look like a breakout is imminent. However, there is a possibility that prices may surge if the market sentiment turns positive. The Solana price has set support at $79.54 and resistance at $83.
Solana price analysis: Recent developments and further technical indications
Recent Solana price analysis shows that the crypto has been on a downtrend since it hit an all-time high of $88. The prices have been on a constant decline and have found support at the $79 level. Prices have surged in the past 24 hours but have failed to sustain the momentum. The market sentiment is currently positive but it remains to be seen if the prices can surge past the $83 level.
The technical indicators are currently giving mixed signals.
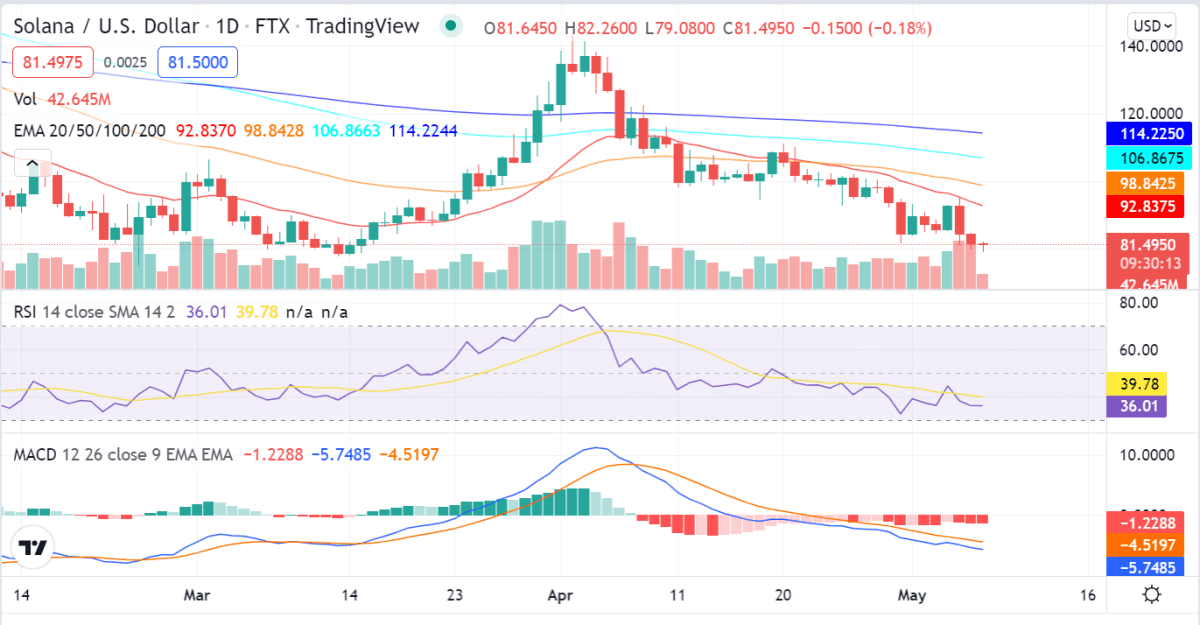
The MACD is in the bearish zone but is close to the centerline. This indicates that the downward momentum may be slowing down. The RSI is currently at 55 and is showing no clear trend. The EMAs are currently close to each other and are flat. This indicates that the price action is currently range-bound. The trading volume for Solana is currently at $677 million and is higher than the average trading volume. This indicates that there is significant interest in crypto.
Solana price action on a 4-hour price chart: Mixed market sentiment
The 4-hour Solana price chart shows that the crypto has been on a downtrend since it hit an all-time high of $88. The prices have found support at the $79 level and have surged in the past 24 hours. However, the market sentiment is currently positive but it remains to be seen if the prices can surge past the $83 level.
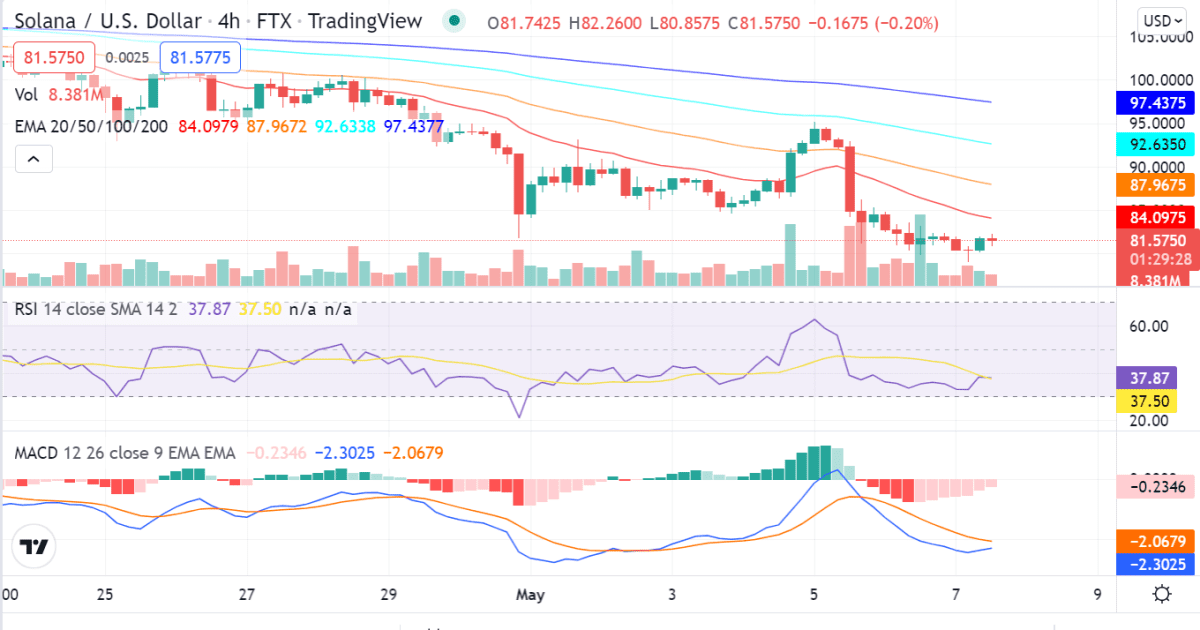
The SOL/USD pair is likely to break higher if the bulls can push the price above the $83 level. The next level of resistance is likely to be at $85. On the other hand, if the bears take control, the price may retrace to $79.The RSI line is currently in the neutral territory which shows that there is no clear trend. The MACD line is close to the centerline which indicates that the downward momentum may be slowing down. The 50day EMA line is currently at $79.78 and the 200day EMA line is currently at $77.41. These lines indicate that the market is in a downtrend but prices may find support at these levels.
Solana price analysis conclusion
The Solana price analysis shows that the crypto has been on a downtrend since it hit an all-time high of $88. The prices have found support at the $79 level and have surged in the past 24 hours. The bears are, however, in control of the market and it remains to be seen if the prices can surge past the $83 level. The technical indicators are currently giving mixed signals which indicate that the market is range-bound.
Disclaimer. The information provided is not trading advice. Cryptopolitan.com holds no liability for any investments made based on the information provided on this page. We strongly recommend independent research and/or consultation with a qualified professional before making any investment decisions.