- BCH token price has been trading at $1307 with an up move of 22.35% in the last 24 hours.
- The 24-hour volume in BCH is at $14,188,666,362 with a 102.21% increase.
- The BCH/BTC pair was trading at 0.02333 BTC with a gain of 18.65%
source-tradingview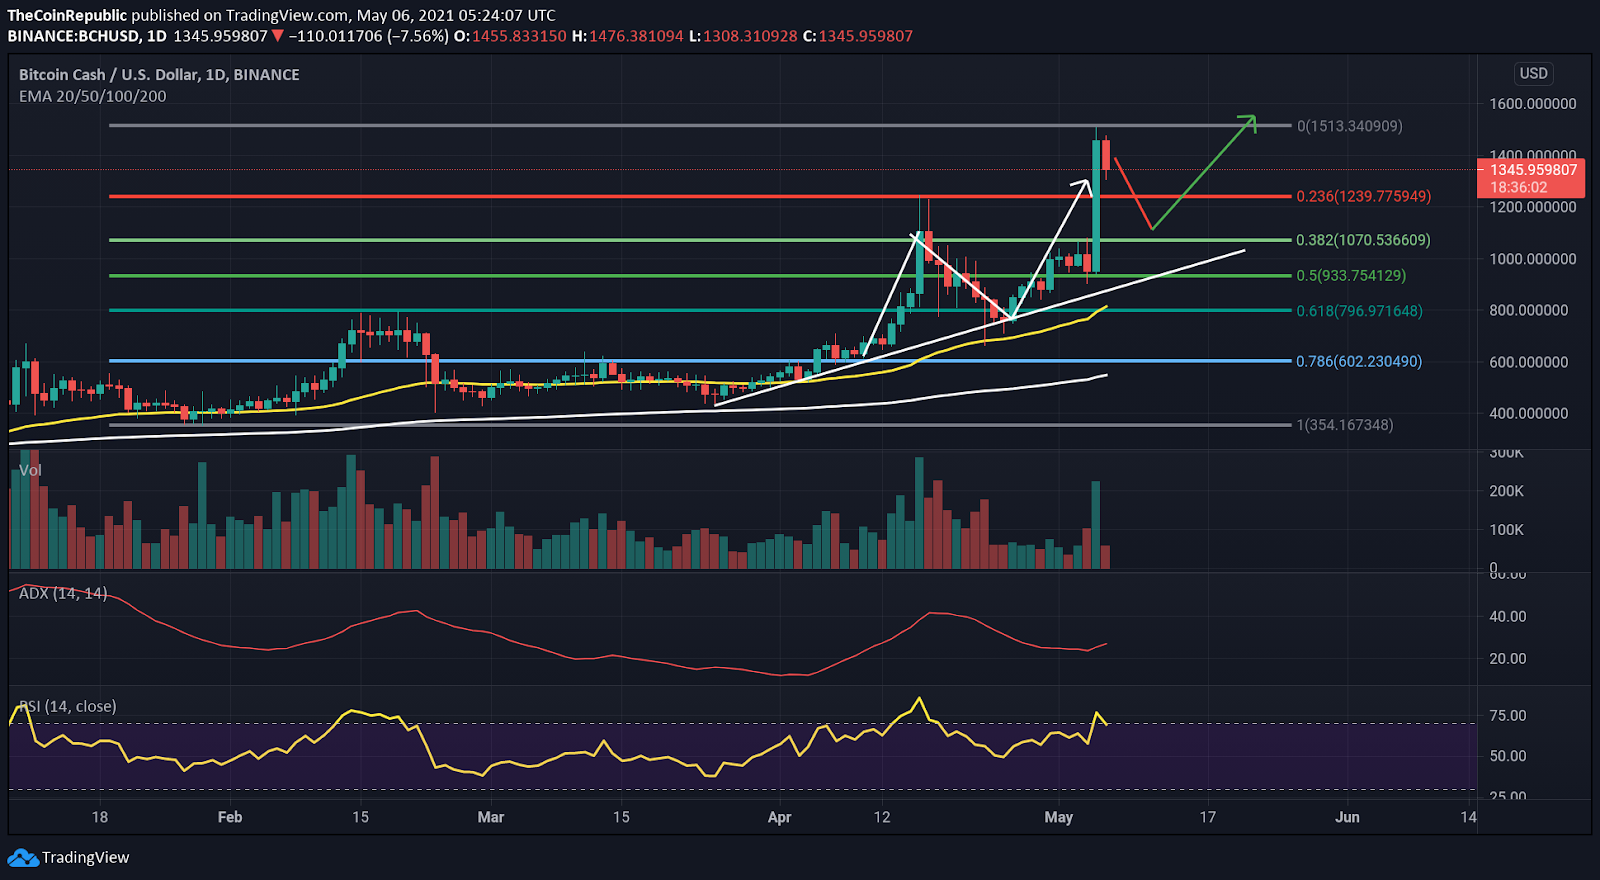
BCH token price is being traded at $1307 with a gain of 22.35% in the last 24-hour. In support, the volume of the coin is boosted by 102%. The token is retracing back to the support level.
BCH coin is indicating that the bulls are overpowering bears despite the upcoming short-term pullback. The live market capitalization of the coin is $6,827,311,789. The coin ranks #9 according to market capitalization.
BCH coin price breaks out with volume burst
source-tradingview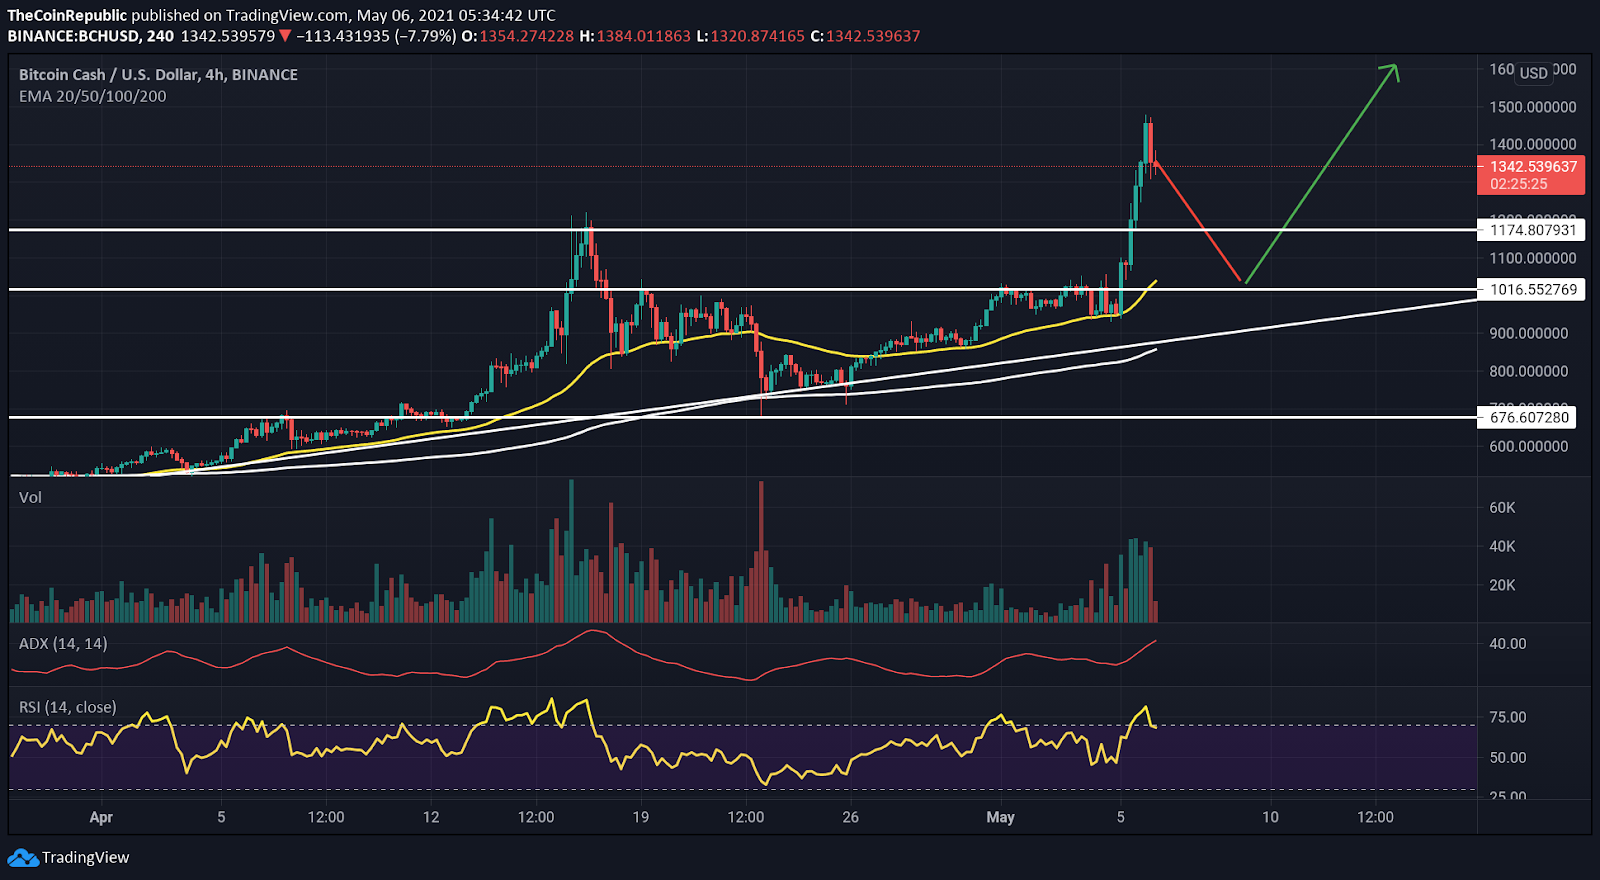
The daily technical chart of BCH token price action forecasts a pullback soon. According to Fibonacci levels, BCH’s critical support level is placed at $1070. Also, the coin price is finding some supply between $1300-$1350.
The increasing selling volume, in the daily timeframe, indicates some underlying weakness in the uptrend. Investors may seek this pullback as an entry opportunity, whereas the price might find support earlier than expected. The immediate support level is $1200.
EMA- (50,200) provides strong support in the coin. 50 EMA (yellow) provided strong support where the coin price made a morning star pattern with a strong bullish engulfing candle. The price is trading above the 50 EMA; investors may seek this as a positive situation to enter as the pullback might find support at 50 EMA. Also, the 50 EMA is above the 200 EMA (white), indicating bulls in control.
The relative strength indicator (bearish), with a value of 66, indicates a sell signal in the coin. Also, the RSI slope did fall from 81 in the last few trading sessions, with the slope driving lower.
ADX indicator, with a value of 37.5 in the 4-hour timeframe, is rising higher, indicating that a boost in downtrend momentum is increasing.
Conclusion – The supply met near the recent 52 weeks high of $1474, which has resulted in the start of the pullback. The pullback is expected to hit the $1070 mark or at least the 50 EMA. Investors may seek this opportunity to buy the dip. At the same time, reversal pattern formation near the support levels must be checked before entering long.
Resistance: $1474
Support: $1200 along with the mentioned EMAs