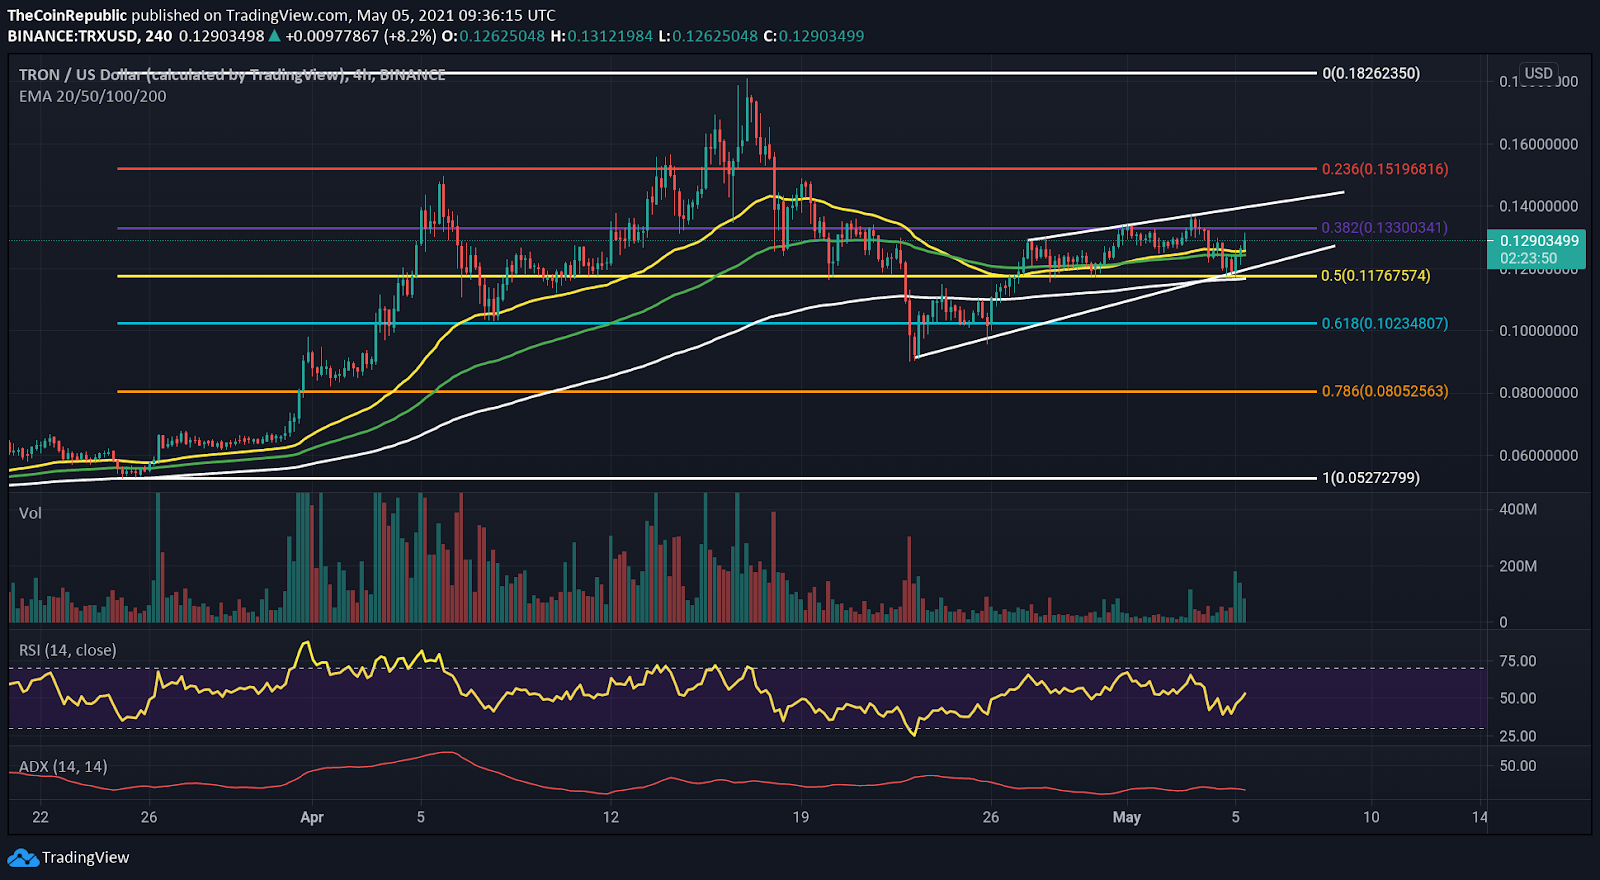
- TRON coin price restarts the uptrend after making a double bottom pattern near the 0.618 Fibonacci level, i.e., $0.102
- TRON continues to trade above all major EMAs, but the declining momentum and volume oppose the bull run
- The pair of TRX/BTC is trading at the level of 0.000002334 BTC with an intraday growth of 2.58%
TRON coin continues to move in an uptrend with constant support from the 50 and 200 EMA. The recent 40% price jump brought the price above the 50 EMA. Coin price made a double bottom pattern with a bullish engulfing candlestick to restart the uptrend. The volumes are declining in the daily timeframe, but the recent increase in buying volume indicates that the bulls are overpowering bears. Today’s live TRON price is $0.129 with a 24-hour trading volume of $3,338,179,453, with an increase of 5.81%.
It is down 0.98% in the last 24 hours. The live market capitalization of the coin is $9,254,355,040.
Volume trouble for TRX
According to the recent weekly report of TRON, the blockchain height surpassed 29.74 million, and the existing total number of accounts reached 30,972,853.
Also, 1.816 billion transactions are recorded in the TRON network. This weekly report is assumed to be the reason behind the sudden increase in buying pressure.
TRON coin price has been making higher highs after finding support from the 50 and the 200 EMA. The coin price is rising higher in a parallel channel and is expected to move in the same fashion. However, the declining volume and the losing momentum might indicate a fallout.
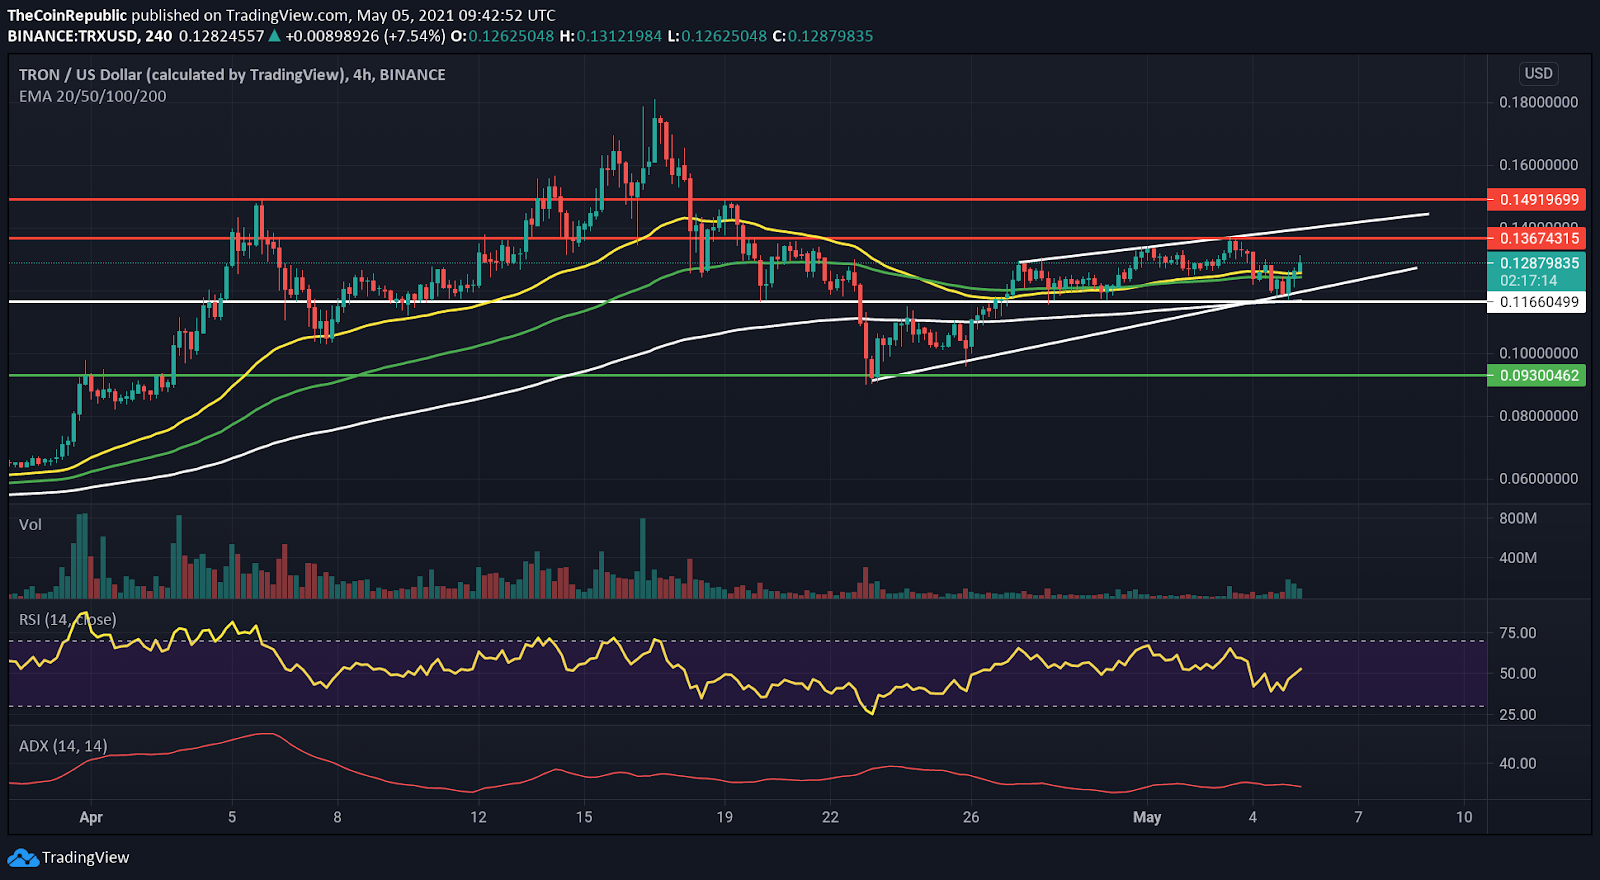
The coin price is trading close to the 50 EMA and finds support on the trendline. The recent increase in buying volume was not enough to break the correction line. The immediate resistance level is $0.136, whereas the support levels are $0.116 and $0.09.
The 50 EMA (yellow) is above 200 EMA (white), implying an uptrend in action in a 4-hour timeframe. However, the 50 EMA is intermingled with the 100 EMA (green), resulting in a bearish crossover soon.
The relative strength indicator trading at 52 is bullish, with the slope spiking up for now with enough space to move even higher before reversing from the oversold zone.
ADX indicator trading at 18.2 implies the gain in trend momentum as the ADX slope is getting ready to head higher.
Conclusion
Support trendline of the parallel channel drives the price higher with the constant support of 50 EMA in the 4-hour timeframe. The breakout of the parallel channel might initiate the bull run, which can be expected, but the volumes are volatile and declining, which must be taken into account before siding with the bulls.
Support – $0.116 and $0.09
Resistance – $0.136