BAND and BNT price forecast point to supported buyers at new all-time highs. A close above $8 may see BNT/USDT rise to $14. On the other hand, BAND/USDT is open to $30.
Band Protocol (BAND)
Reliable oracles linking smart contracts to reliable, tamper-proof data have been a game-changer. Being one of the solutions, the Band Protocol and its governance token, BAND, continues to edge higher.
Past Performance of BAND
Candlestick arrangement in the daily chart reveals strength. The BAND price remains on a bullish path. The BAND price is trading at $19, adding 15 percent versus the USD on the last day.
It is firm against ETH and BTC—gaining on average 19 percent– at the back of increasing trading volumes on the last day.
Day-Ahead and What to Expect
BAND/USDT price analysis favor buyers even though they remain within a $9 zone with caps at $11 and $20.
Technically, a break above Feb 2021 and Q1 highs may see the BAND price soar to new highs in a buy trend continuation pattern.
On the other hand, failure for buyers to break above these liquidation walls may see BAND prices slide back to consolidation.
BAND/USDT Technical Analysis
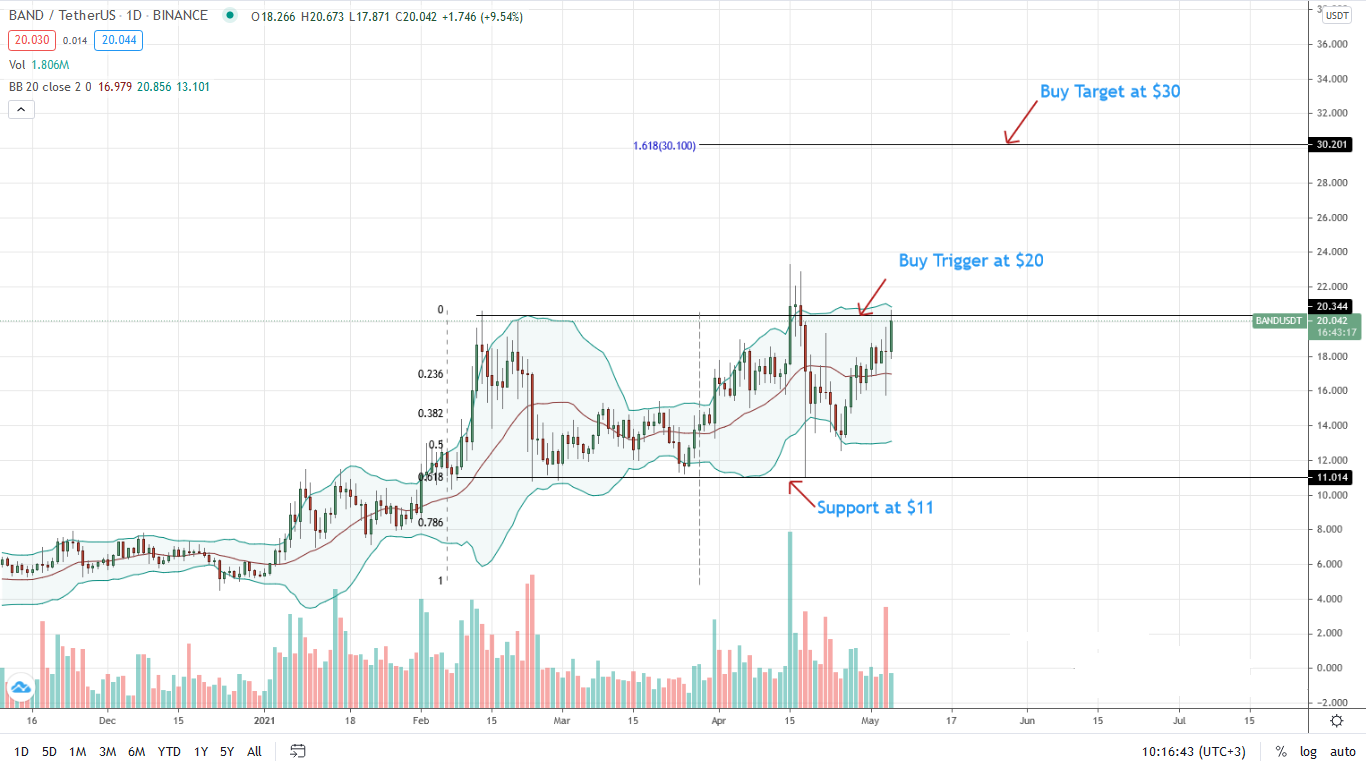
Participation is within average, a possible precursor for a breakout above $20, reversing losses of mid-April.
Aforementioned, a comprehensive close above $20 could trigger a wave of BAND/USDT buying pressure, lifting prices to $30.
If not, bears will flow back, forcing back prices to consolidation. From an Effort-versus-Results perspective, BAND price action—in light of losses from Apr 18, favor buyers since there haven’t been a complete reversal of Apr 18 and 19 dumps down.
Bancor (BNT)
DEXes ushered in DeFi. Bancor, using the BNT governance token, is a front-runner. The protocol has so far swapped over $2 billion of tokens.
Past Performance of BNT
The BNT price is under pressure but is bottoming up.
Trading at $7.35, it is stable versus the USD and up roughly four percent against BTC and ETH.
At the same time, trading volumes are up 43 percent, building a case for buyers and BNT higher highs.
Day-Ahead and What to Expect
BNT/USDT technical analysis and general candlestick arrangement point to support. However, the middle BB is now negatively slanting, suggesting selling pressure. Still, the uptrend is solid, especially if BNT prices close above $8.
On the lower end, Apr 2021 low–at $6– is the immediate sell trigger.
BNT/USDT Price Forecast
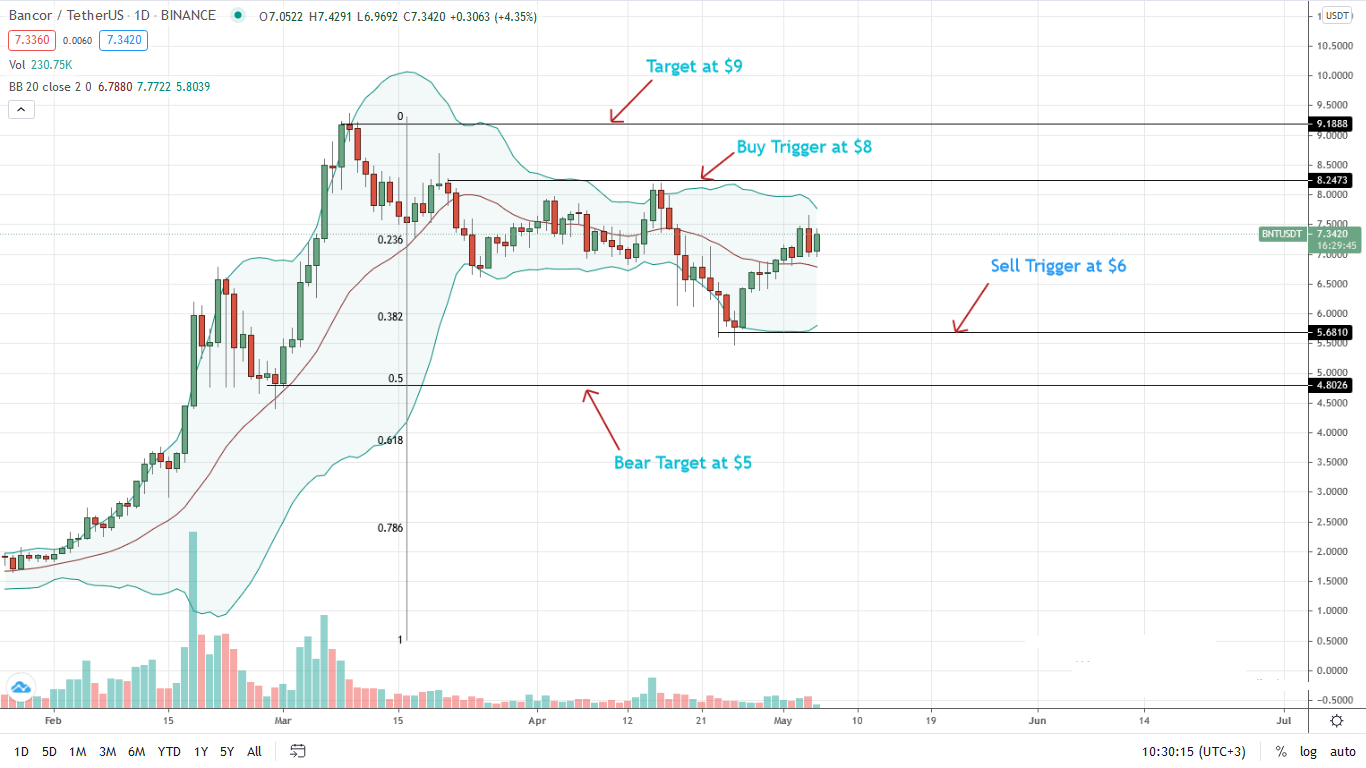
BNT/USDT prices are oscillating above the middle BB.
Although aggressive traders can buy the dips, a close above $8 may see BNT rise to $9 and even $14—the 1.618 Fibonacci extension of the Q1 2021 trade range.
Losses below $6—Apr lows may spark a dump down towards $5—and worse.