Dogecoin price analysis shows bearish signs in terms of price movement, as the meme cryptocurrency incurred more than 4 percent in losses over the past 24 hours to move as low as $0.126. After yesterday’s uptrend to take price up to $0.137, short-term traders took off from the market, pushing price downwards. However, price currently sits in the demand zone and could propel up to $0.2 if incoming buyers can consolidate above $0.139. Trading volume for Dogecoin over the past 24 hours increased by more than 55 percent, while market capitalization fell by 4 percent.
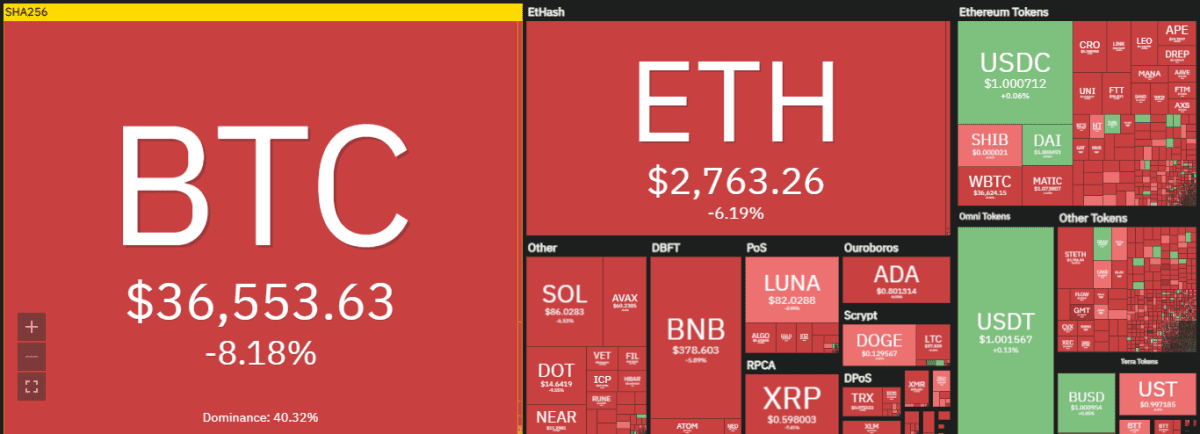
The larger cryptocurrency market faced significant losses today, as the largest cryptocurrency Bitcoin bled down to $36,500 with an 8 percent decrement. Ethereum lost 6 percent to move down to $2,700, while major Altcoins also provided a bearish outlook. Ripple went down more than 7 percent, with Cardano losing 8 percent and Terra 5 percent. Solana and Polkadot dropped 6 and 10 percent, respectively, whereas the Binance token went down to $378.60 with a 6 percent decline.
Dogecoin price analysis: DOGE forms bearish divergence on daily chart
On the 24-hour candlestick chart for Dogecoin price analysis, price can be seen forming another descending triangle since the minor uptrend on May 4, 2022. The 24-hour relative strength index (RSI) shows a decremental trend at 43.46 which shows market valuation is dropping. Coupled with a 55 percent increase in trading volume, the immediate outlook for DOGE is bearish. However, Dogecoin formed three lower highs and lower lows and a falling wedge pattern is found when these are connected. It forecasts a 68 percent upswing up to $0.235.
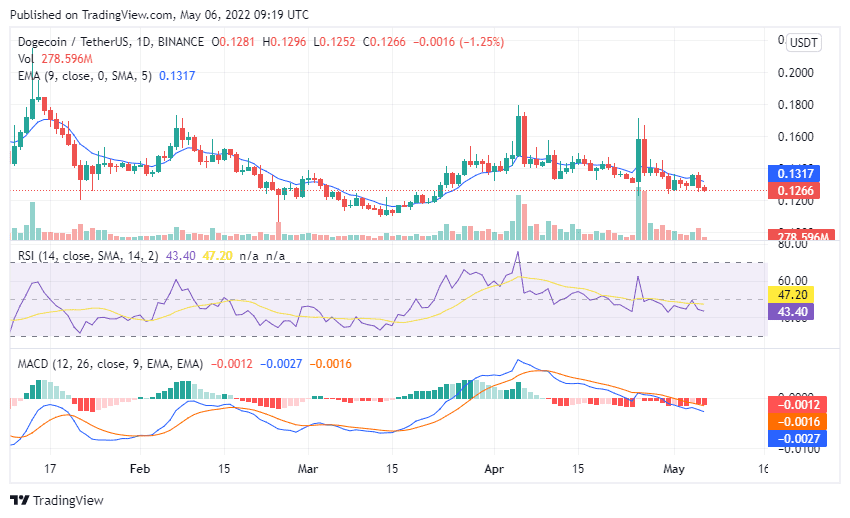
For now, DOGE sits outside the falling wedge after declining more than 4 percent today, but has bounced into the demand zone at $0.124 where buyers are expected to come into the market. Price is expected to target the crucial 50-day exponential moving average (EMA) at $0.132 over the next 24 hours. Moreover, the moving average convergence divergence (MACD) curve supports the current bearish sentiment, forming bearish highs below the neutral zone which could be reversed as soon as an uptrend is found. A weekly close above $0.259 would confirm the uptrend and trigger the potential 68 percent rise.
Disclaimer. The information provided is not trading advice. Cryptopolitan.com holds no liability for any investments made based on the information provided on this page. We strongly recommend independent research and/or consultation with a qualified professional before making any investment decisions.