Cardano price analysis is in favor of the bullish side today as the bulls are striving to elevate the price level. ADA rallied towards $0.900 on 4 May 2022, which was an unmatched performance from the bullish side after a long interval, as the trend remained downwards for the entire month of April 2022. A jump towards the $0.900 level was a big relief for buyers until the price corrected straight down on the very next day. The correction was quite strong, and it wiped out 90 percent gains made. However, bulls are trying to make a comeback today, and the price function is oscillating upwards now but at a slow speed.
ADA/USD 1-day price chart: ADA needs more support from the buyers’ side
The one-day price chart for Cardano price analysis shows the appearance of a small green candlestick which hints at the restoration of the coin value. Highly volatile price action has been observed during the last few days as the price oscillated fast up and down.
The crypto pair is trading at $0.790 at the time of writing, and it has been at a loss of 9.17 percent for the last 24 hours. And over the past week, the trend line is also downwards as bears rejected the bullish efforts, and the coin lost 5.21 percent value during this time. The trading volume has also decreased by more than 7.32 percent over the past day, and the moving average (MA) is trading around $0.802 above the current price level.
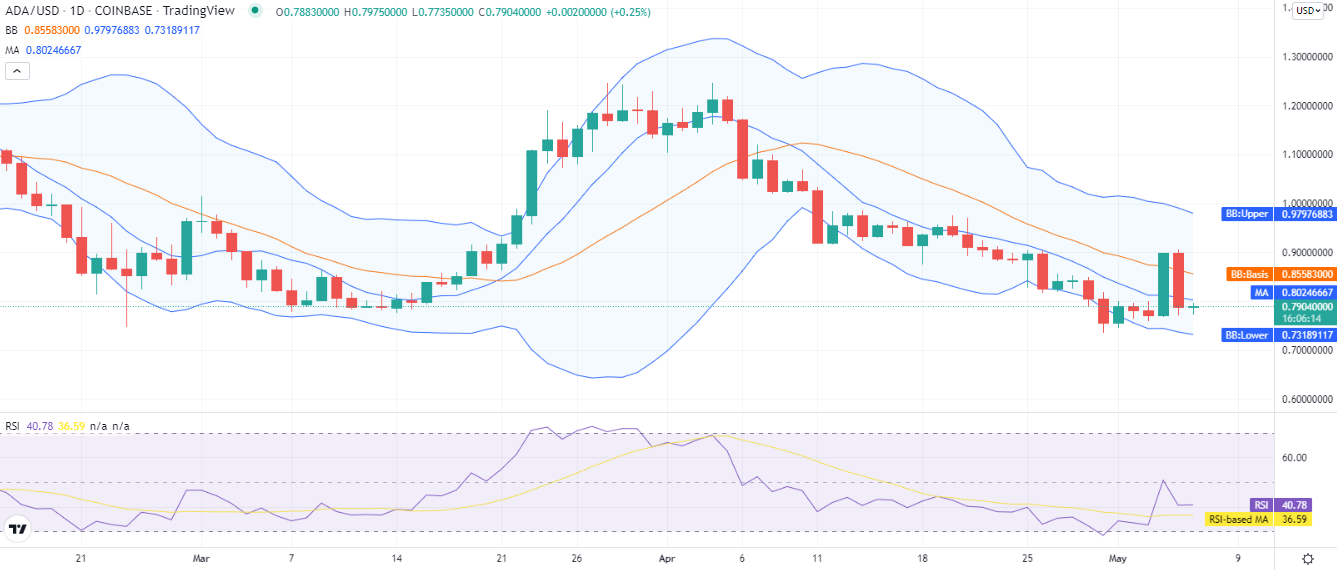
The SMA 50 is going higher than the SMA 20 curve as the major trend line is still going downwards. The volatility is also on the higher side, with the upper band at $0.979, representing the strongest resistance for ADA, and the lower band is trading at $0.731, representing the strongest support for ADA. With the support appearing for ADA price, the Relative Strength Index (RSI) now shows sideways movement at index 40 after crashing down from the center of the neutral zone.
Cardano price analysis: Recent developments and further technical indications
In the 4-hours price chart for Cardano price analysis, a slow but steady increase in price levels has been observed during the last eight hours. Support appeared for ADA during the previous trading session when the price touched a $0.790 low after a stronger correction was observed four hours earlier. But bullish efforts were rejected again as another smaller correction was also observed at the end of the trading session. However, today’s price breakout was upwards, and the bulls are still carrying their lead.
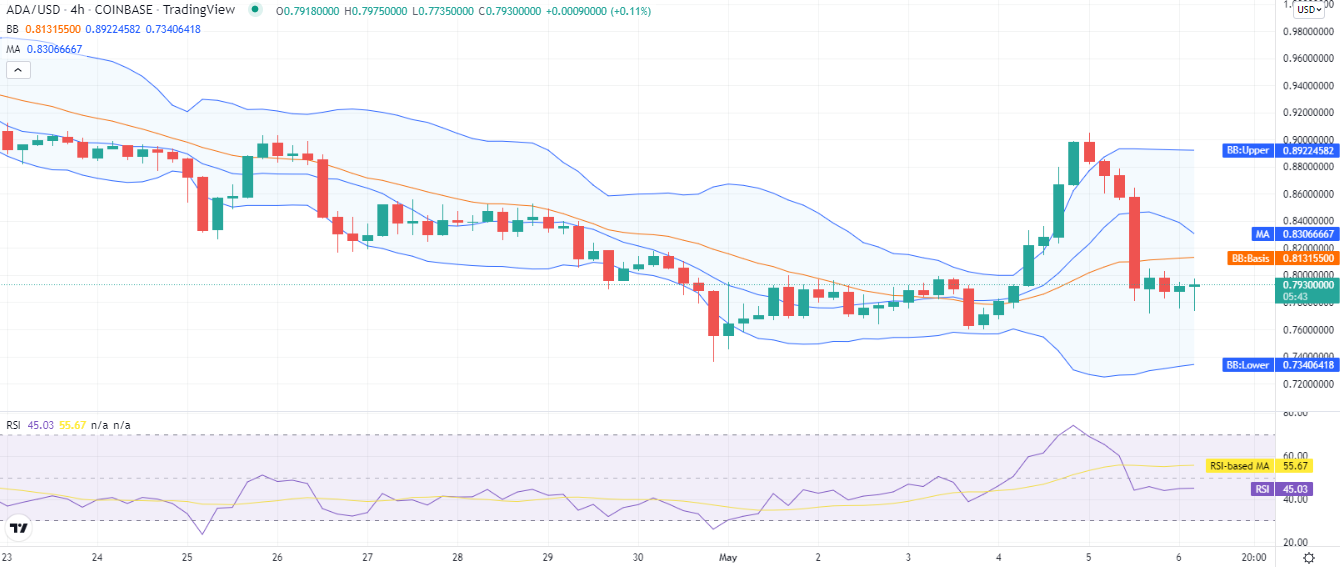
The four-hour chart also shows high volatility on an hourly basis, with the upper value trending at $0.892 and the lower one at the $0.734 mark, and the price is trading below the mean average line of the indicator, which is present at $0.813 level. The RSI curve shows sideways movement, with the indicator hovering at index 45. The horizontal movement hints at a lack of moment from the bullish side.
Cardano price analysis conclusion
Cardano price analysis suggests that the cryptocurrency price function is experiencing instability, but bulls managed to stop the price slippage after a strong correction. On the other hand, the bullish momentum also seems weak and more support is required to make a break above $0.800; otherwise, the price may sink down near $0.700 during the next trading session.
Disclaimer. The information provided is not trading advice. Cryptopolitan.com holds no liability for any investments made based on the information provided on this page. We strongly recommend independent research and/or consultation with a qualified professional before making any investment decisions.