This week, as the cryptocurrency market continues to switch between red and green, XRP has also witnessed uncertainty, doom and gloom in the market lately. This week, the coin varied at a trading price from $0.4 to $0.34, approximately.
At press time, XRP was trading at a depreciated price of $0.36 with a market cap of $14.55 billion. The total 24-hour trading volume was recorded at $324.1 million.
1-hour:
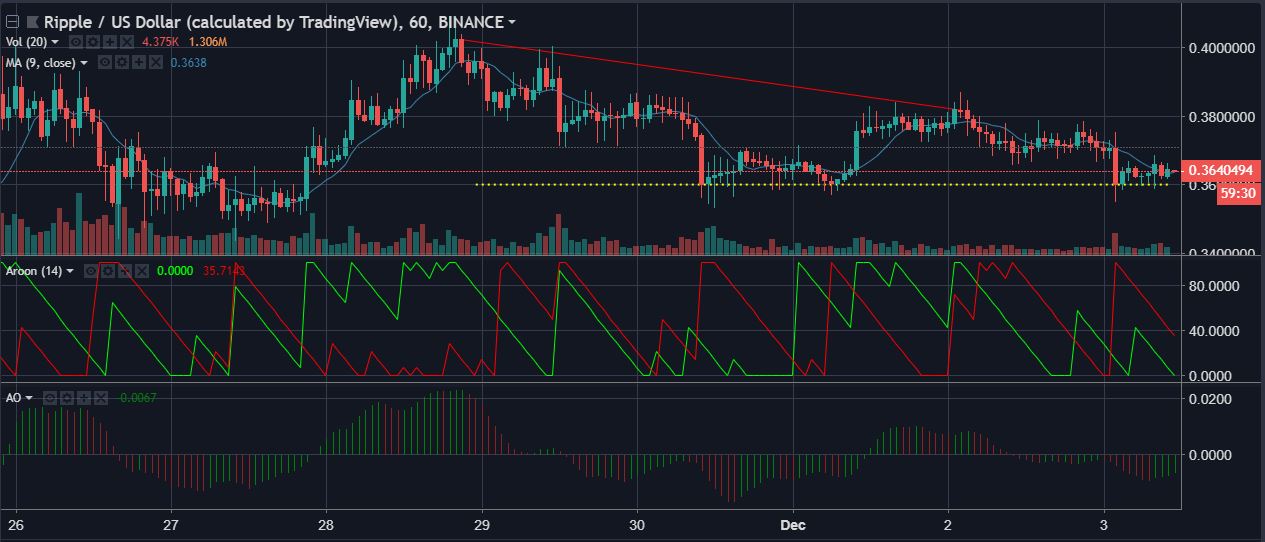
XRPUSD 1-hour candlesticks | Source: tradingview
In the 1-hour time frame, there is a slight downtrend that can be observed on the chart, extending from $0.4 to $0.38. Here, a strong support is fixed at $0.36, wherein the price has been witnessed to make contact and bounce back up multiple times using the same support level.
A trend breakout may also be seen in the upcoming period as the price is showing much concentration.
Moving Average is pointing downwards with the ongoing trend. This suggests that XRP might stay in the bear-zone for a while before experiencing a market shift.
The Aroon Indicator is also predicting a weaker uptrend in relation with its counterpart. However, the downtrend is also witnessing strength-loss as the chart aptly depicts.
Meanwhile, the Awesome Oscillator is glowing green to side with the bull. The bars have turned the safe switch on to communicate the indicator’s stance.
1-day:
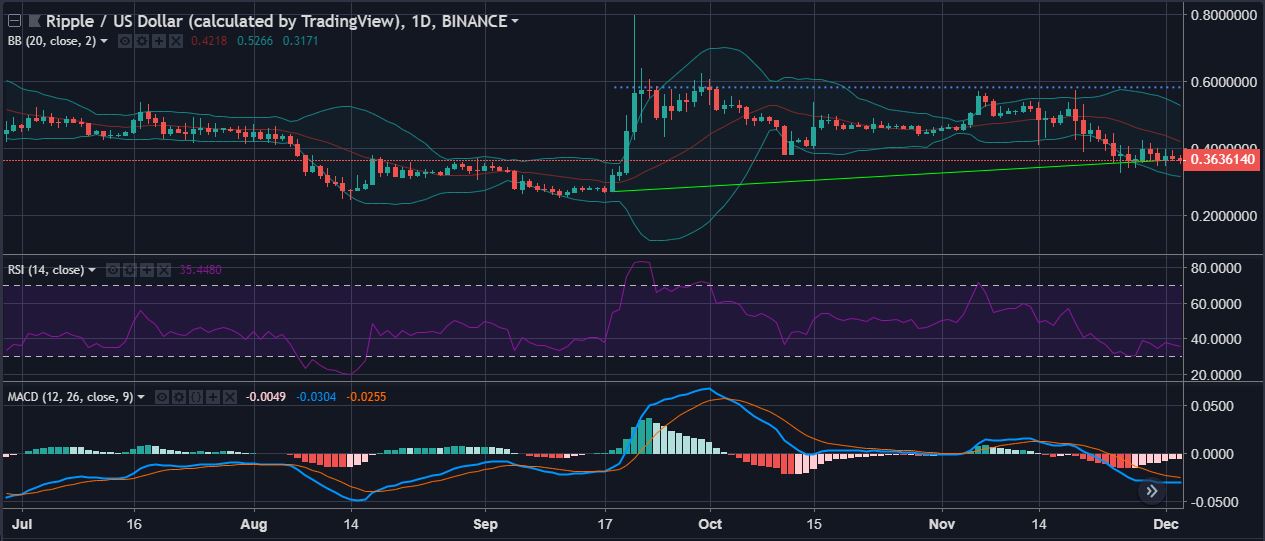
XRPUSD 1-day candlesticks | Source: tradingview
In the long-term, the trend is observed to have reversed as a slight uptrend can be noticed in the 1-day chart of the coin. The support line is extending from $0.27 to $0.36 whereas the resistance level is fixed at $0.58. Here, there is no possibility of a trend breakout as of now.
The Bollinger Bands are broadening their neck to indicate an upcoming increase in volatility for the XRP price trend.
The RSI indicator is bearish on the XRP market as the reading line is seen to be crashing into the bear’s territory. The indicator made an attempt to pick itself up after contacting the oversold zone but is approaching downwards again.
The MACD made a bearish crossover earlier to support a negative prediction for the coin. Agreeing with the above indicator, MACD is currently traveling below the signal line to confirm the stance.
Conclusion:
In this technical analysis, it is clearly seen that the majority of indicators are predicting a bearish run for the cryptocurrency. The Bollinger Bands have also conveyed much volatility in the upcoming market.