- Zcash coin price restarts the uptrend after making a morning star pattern near the $182 mark
- Zcash continues to trade above all major EMAs, but the declining momentum and volume oppose the bull run.
- The pair of LTC/BTC is trading at the level of 0.0.004206 BTC with an intraday loss of -2.18%
source-tradingview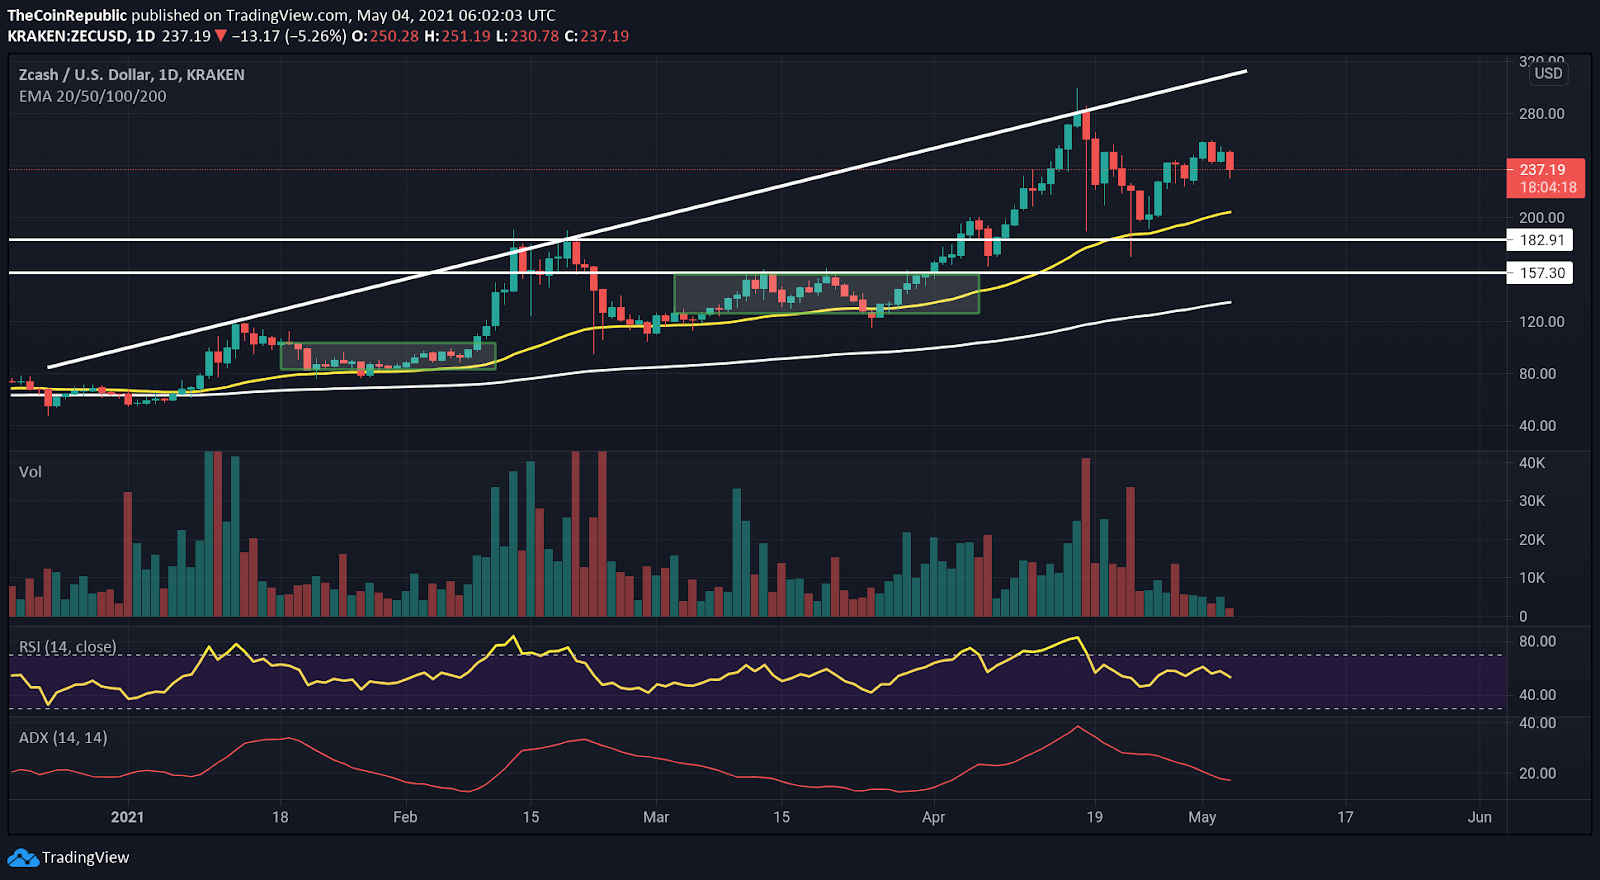
ZCASH coin continues to move in an uptrend with constant support from the 50 EMA. The recent 35% fall brought the price close to the 50 EMA. Coin price made a morning star pattern with a bullish engulfing candlestick to restart the uptrend.
The volumes are declining in the daily timeframe but the recent increase of buying volume does indicate that the bulls are overpowering bears.
The third consolidation wave is expected but the bullish indicators initiate the bull run sooner than expected. The live Zcash price today is $236.16 with a 24-hour trading volume of $607,955,538. Zcash is down 5.27% in the last 24 hours. The live market capitalization of the coin is $2,761,666,739.
Bull Run sooner than expected
source-tradingview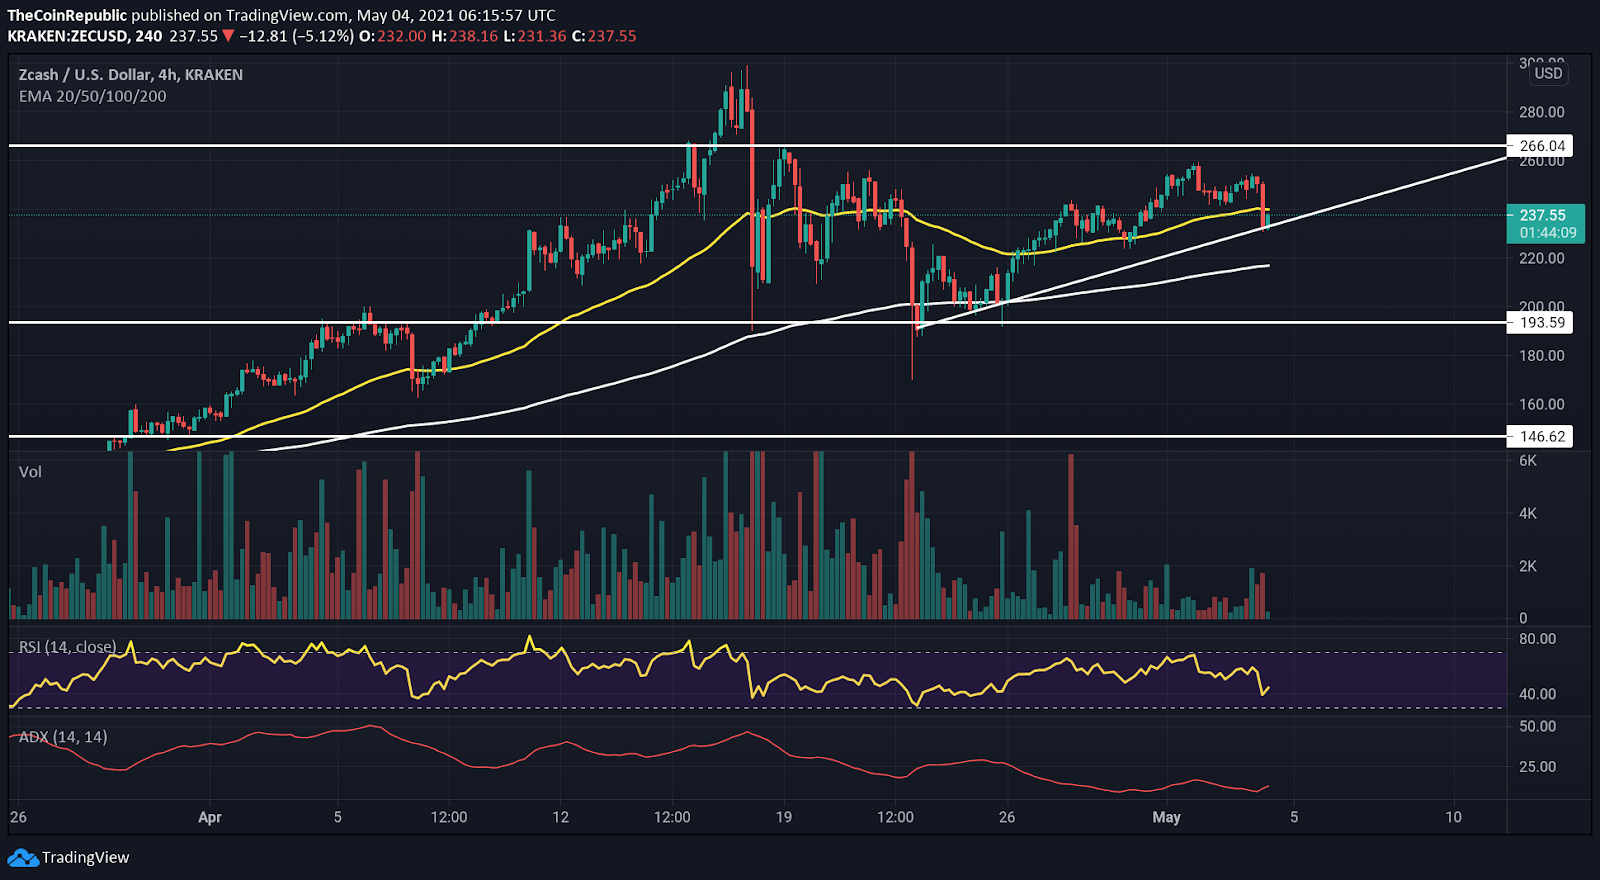
Zcash coin price has been making higher highs after finding support near the $190 level and the 200 EMA. The coin price is rising higher in the ascending triangle pattern and is expected to break out soon.
The coin price is trading close to the 50 EMA and finds support on the trendline. The recent increase in selling volume was not enough to break the trendline implying the underlying sentiment is bullish.
The immediate resistance level is $266, whereas the support levels are $193 and $150.
The 50 EMA (yellow) is above 200 EMA (white), implying an uptrend in action in a 4-hour timeframe. Price is trying to push higher than the 50 EMA, which adds up to this idea.
The relative strength indicator trading at 46 is bullish, with the slope spiking up for now, and if the price breaks out of the $266 level, then RSI could boost up even higher.
ADX indicator trading at 13.2 implies the gain in trend momentum as the spike of ADX slope is getting ready to head higher.
Conclusion- Support trendline of the ascending triangle drives the price higher with the constant support of 50 EMA in the daily timeframe. The breakout of the $266 level might initiate the bull run, which can happen soon. The volumes are volatile and declining, which must be taken into account before siding with the bulls.
Support – $193, $150
Resistance – $266