Tezos price analysis reveals that the bearish trend in XTZ prices continues, as the cryptocurrency trades below the previous support level. The path of least resistance is to the downside and it seems like the XTZ/USD pair might head towards $2.2 if it breaks below $2,45.The key support level in the XTZ market is at $2.45, and a break below this could signal further declines. However, if the bulls are able to defend this level and push prices above $3.00, we could see a reversal in trend and a move back towards $4.00 or even higher levels.
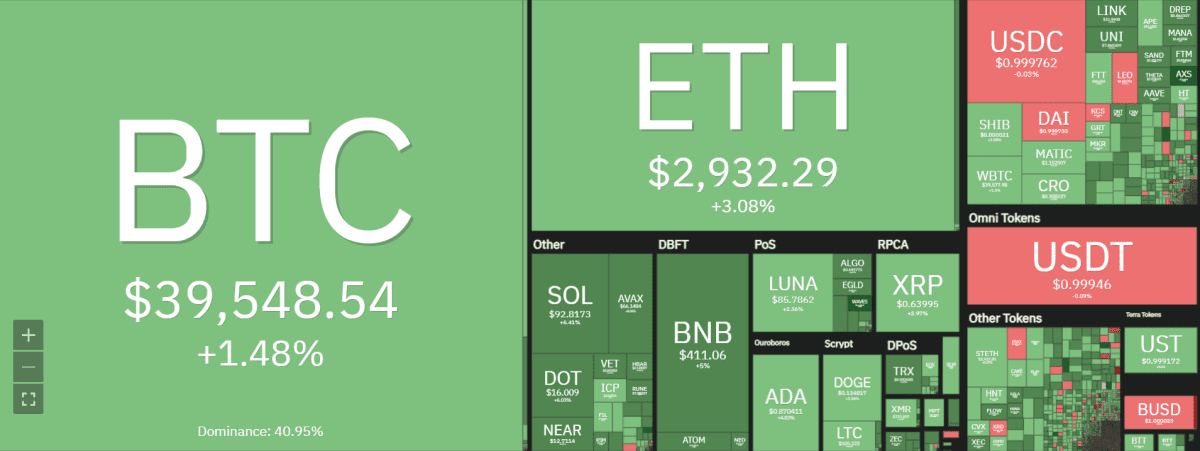
Tezos price has been declining in most part of the days as it is down by 4.2% in the last 24 hours and currently, it is trading below $2.5. XTZ/USD opened the day at $2.61 and it slipped below $2.5 to an intraday low of $2.49. The cryptocurrency has seen a decline in the trading volume which is at $161,333,856.09 as the cryptocurrency ranks position 42 overall. Tezos market capitalization is at $2.226 billion while the market dominance is 0.13 percent.
Tezos price analysis: Technical analysis
The technical picture for XTZ/USD shows that the pair is facing strong resistance at $2.55 and if it fails to break above, we could see a move towards $2.40 which is the next support level. The RSI indicator is in the oversold territory, which means that there might be some buying pressure soon.
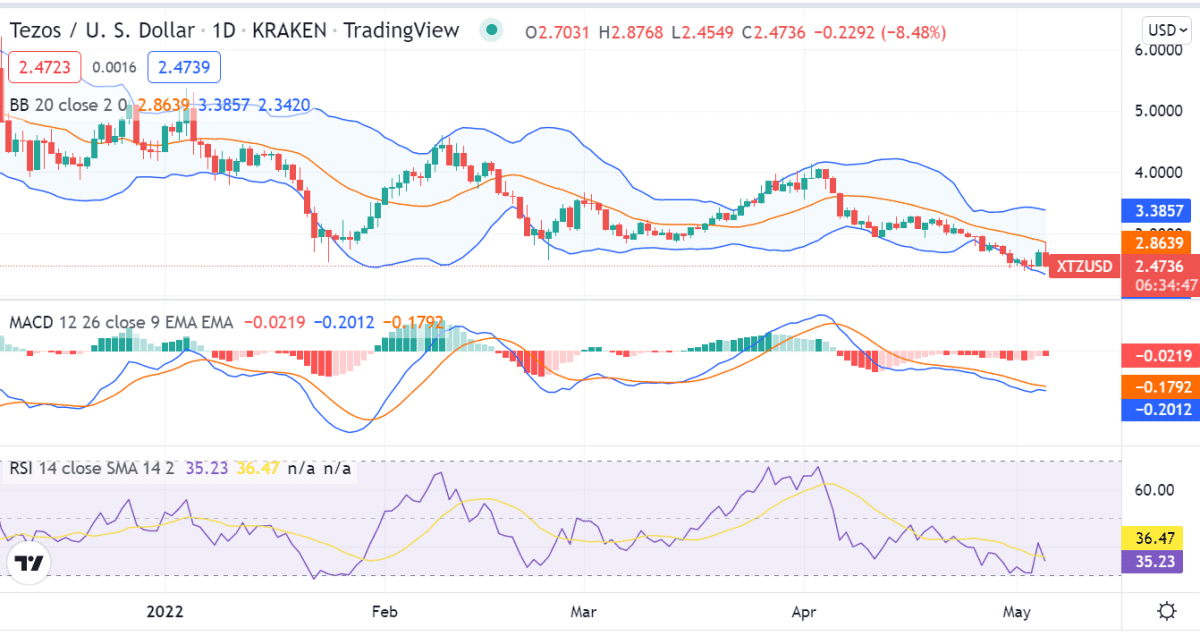
The Moving Average Divergence Convergence MACD line is close to crossing below the signal line, which could be a bearish signal. The support levels are at $2.40 and $2.20 while the resistance levels are at $2.55 and $3.00.The line is currently at the $2.40 level and it might remain there until we see some movements in the market.
The EMAS are close to each other and they might remain there for some time. The support levels are at $2.40 and $2.20 while the resistance levels are at $2.55 and $3.00.The Bollinger Bands show that the market is in a bearish phase as the prices are trading below the middle line. The lower band is lying at $2.49, acting as the short-term support level. The Tezos market is currently in a bearish phase as the prices are trading below the key support levels. The next support level is at $2.40 and if the prices break below this, we could see a move towards $2.20 which is the next support level.
Tezos price analysis on a 4-hour price chart: Selling pressure pushes XTZ prices to lows of $2.49
The 4-hour chart for XTZ/USD shows that the prices are trading near the support level at $2.40, with a slight bearish bias in the market. The Parabolic SAR indicator is close to reversing from its bullish phase into a bearish one and if this happens, it could signal further declines in prices. The market volatility for XTZ prices is on the rise, as the Bollinger Bands are seen widening. This usually happens when there is an increase in market uncertainty. The MACD line is close to crossing below the signal line which could be a bearish signal.
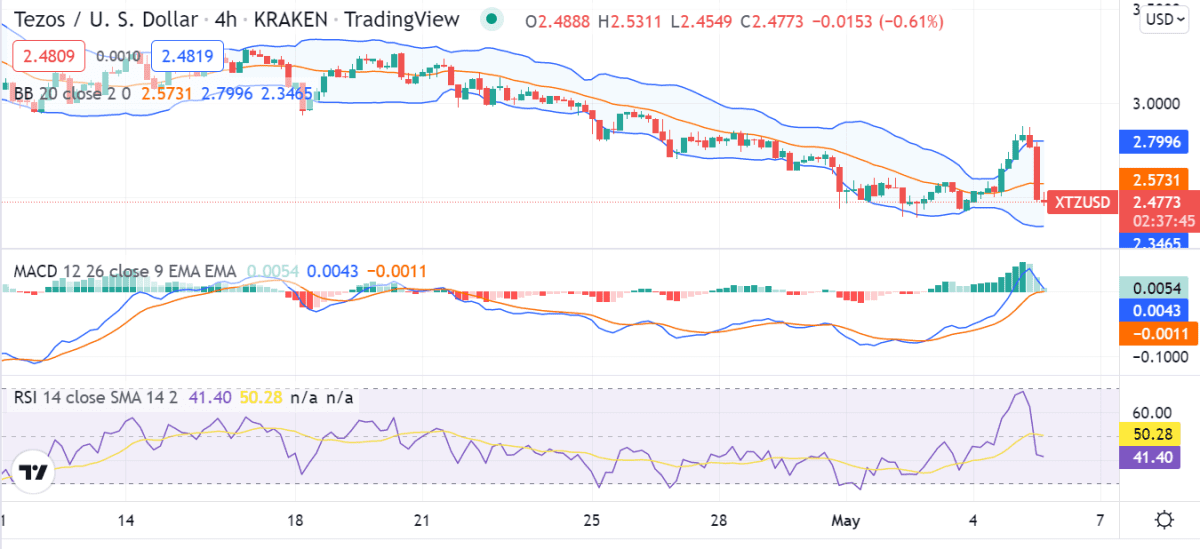
The RSI indicator is in the oversold territory and this usually happens before we see a market reversal. The support levels are at $2.40 and $2.20 while the resistance levels are at $2.55 and $3.00.The Tezos market is currently in a bearish phase as the prices are trading below the key support levels.
Tezos price analysis conclusion
Tezos price analysis shows a negative market sentiment as prices dip further as we approach the closure of today’s trading session. The technical indicators are mostly bearish, signaling further declines in prices. The next key support levels to watch for XTZ prices are at $2.40 and $2.20, which if breached could signal a move to $2.00 in the coming days. However, there are also some positive indicators as well, such as an oversold RSI level on the 4-hour price chart for XTZ/USD. A reversal from these levels could see a recovery back to $2.55 in the short term.
Disclaimer. The information provided is not trading advice. Cryptopolitan.com holds no liability for any investments made based on the information provided on this page. We strongly recommend independent research and/or consultation with a qualified professional before making any investment decisions.