- Binance coin price is trading on a bullish note over the monthly chart while holding all critical moving averages
- BNB price is creating a divergence with the volume as the price is in an uptrend, while volume is decreasing
- Similarly, the pair of BNB/BTC is also trading near the all-time high of 0.0108 BTC with intraday gains of +0.75%
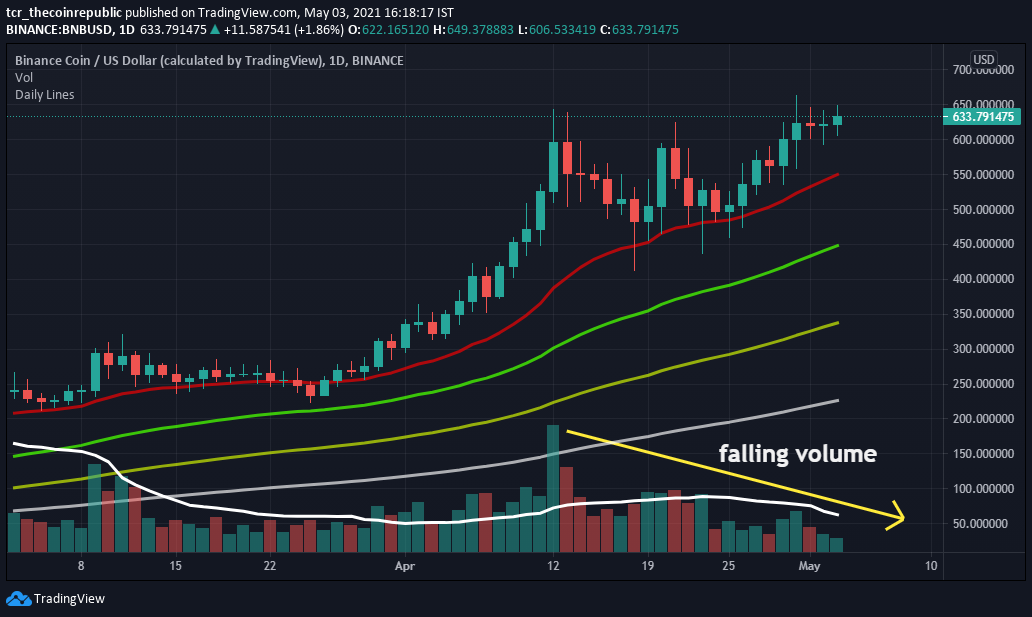
Binance coin price creates divergence with the volume, as the price is trading in an uptrend with falling volume. BNB over the monthly chart creates higher high and lower low sequence, while the price reached near the all-time high of $642. In comparison, the primary concern is volume, as it falls below the average line since the overall long-term trend is still bullish. Meanwhile, BNB is successfully placed above all major moving averages of 20, 50, 100, and 200-Day, while 20-DMA is acting as short-term support. Moreover, the major support on the lower side is $530 and $450, whereas resistance on the higher side can be considered $645 and $690.
BNB Expecting New all Time High Soon
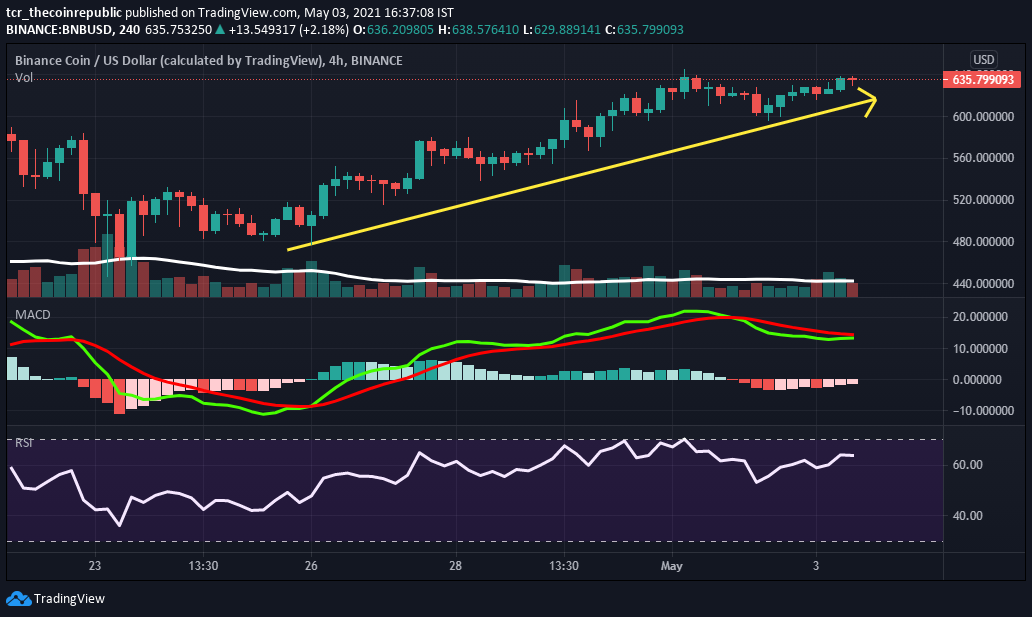
After a strong bull run, the Binance coin price now seems overbought, and we can expect a new all-time high soon. Meanwhile, we can also expect a short-term correction or negative retracement from higher levels. Over the weekly chart, bullish momentum is seen in the digital asset, whereas technical parameters indicate caution at current levels. However, BNB trades at the price level of $637 with intraday gains of +3.41%. While maintaining its 3rd rank is standing at $97,875,149,088. Likewise, the volume also witnessed an intraday bounce off 2.01% remaining at $3,725,696,552. Short-term support on lower levels is placed at $570 and $545. Similarly, resistance on the higher side is situated at $645 and $660.
Relative Strength Index (CAUTION) indicates a bullish momentum while trading at 65.86. However, it is currently trading near the overbought zone after recovering from lower levels. some correction is expected as it is placed near the overbought zone.
Moving Average Convergence Divergence (CAUTION) currently indicates a neutral trend on the daily chart as giving a mixed crossover of buying signal line (green) over sellers line(red) with upcoming positive crossover.
Support levels: $530 and $450
Resistance levels: $645 and $690.