- DGB bull rally got cut short after smashing a new ATH at $0.18
- DGB is currently trading at a high of 17.12% from a 25% low of its 52 week high
- DGB Foundation agrees strategic partnership with LCX
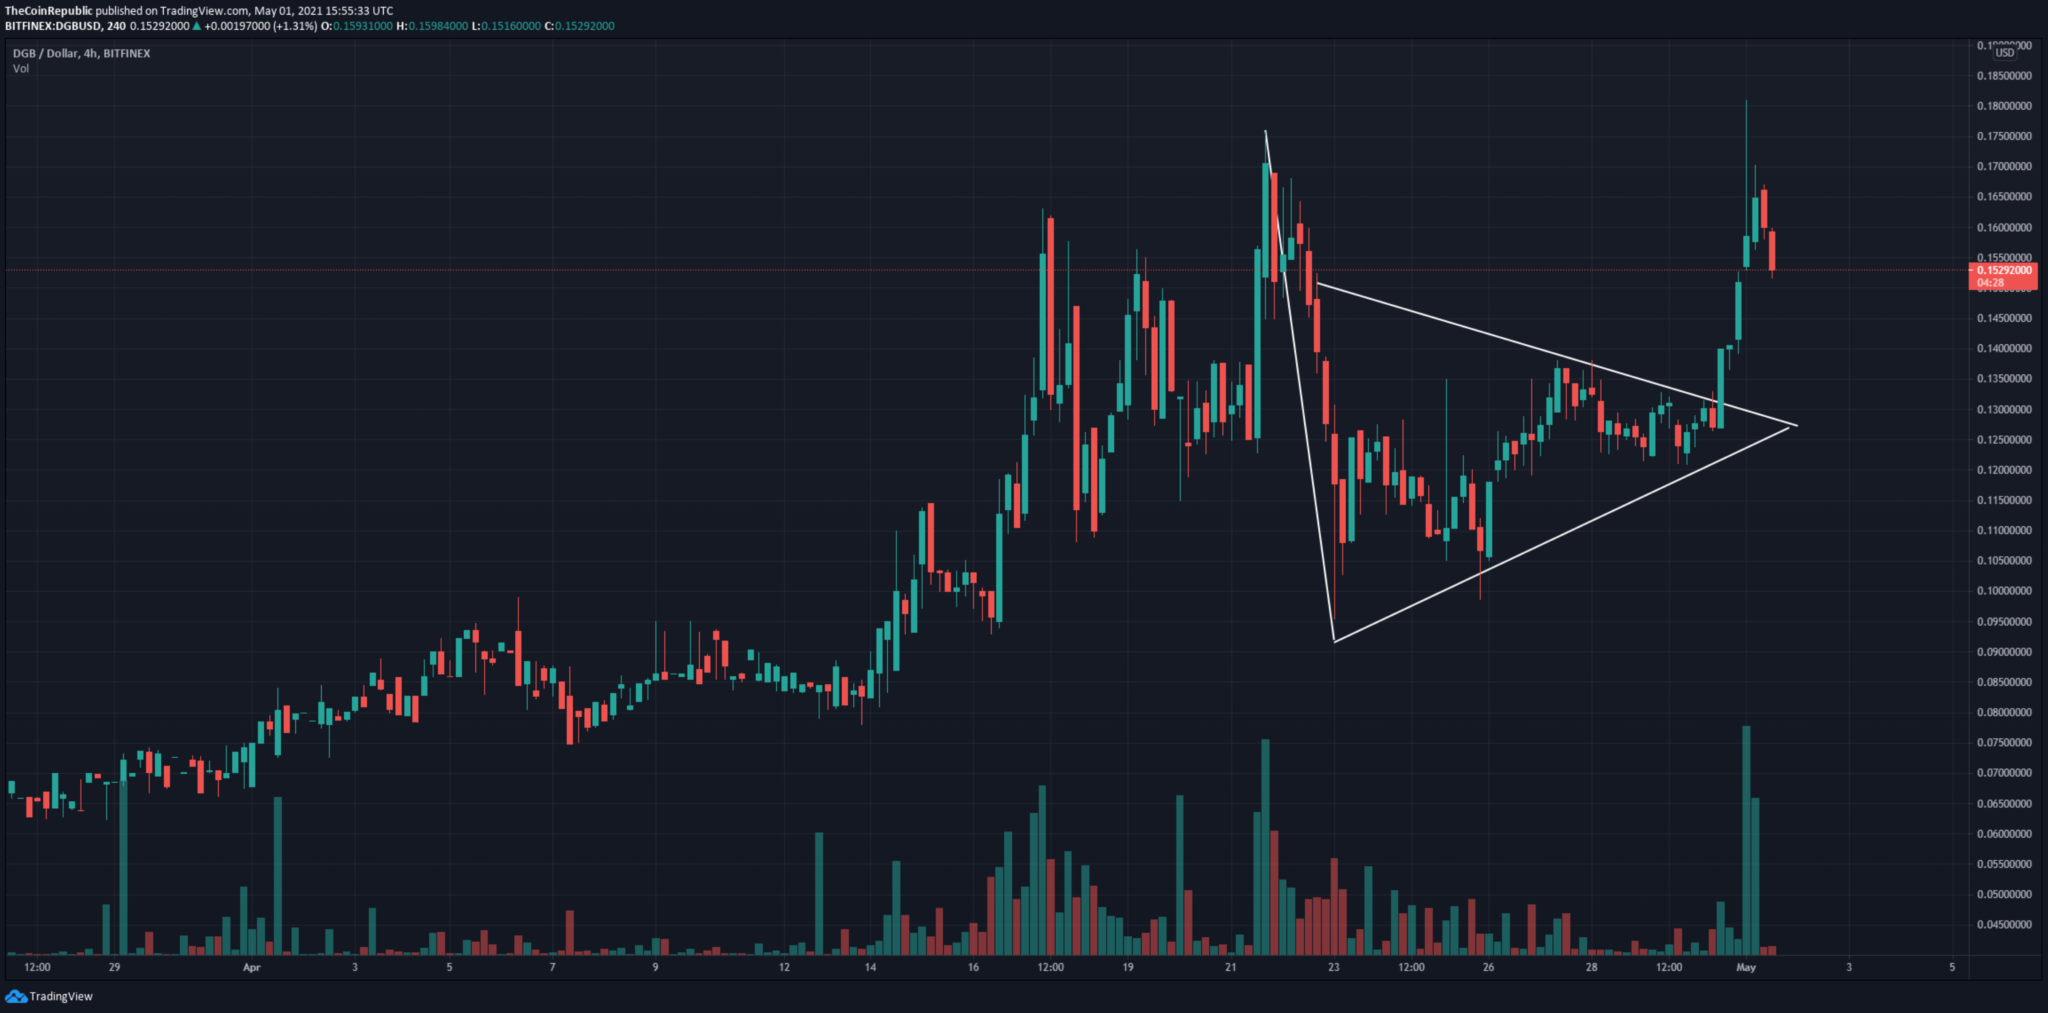
After consolidating the tight range of $0.12 to $0.13, DGB price action finally broke out towards the upside from the bearish flag pattern on the 4-hour chart. The price skyrocketed by 42% in a short span of two days.
However, the rally got invalidated because the price action formed a massive inverted hammer candlestick at the summit of the uptrend.
An inverted hammer at resistance often indicates the possibility of a trend reversal or a minor pullback. Later today, the price plunged by almost 14% and is currently trading at a low of $0.15.
The volume has increased by threefold since the last couple of days, and the fact that today’s fall dint attracts many sellers suggests that bulls still have the upper hand. If the bearish momentum continues for long, traders can expect $0.13 to swoop in as a major support level.

A minor pullback and the beginning of a major bull rally

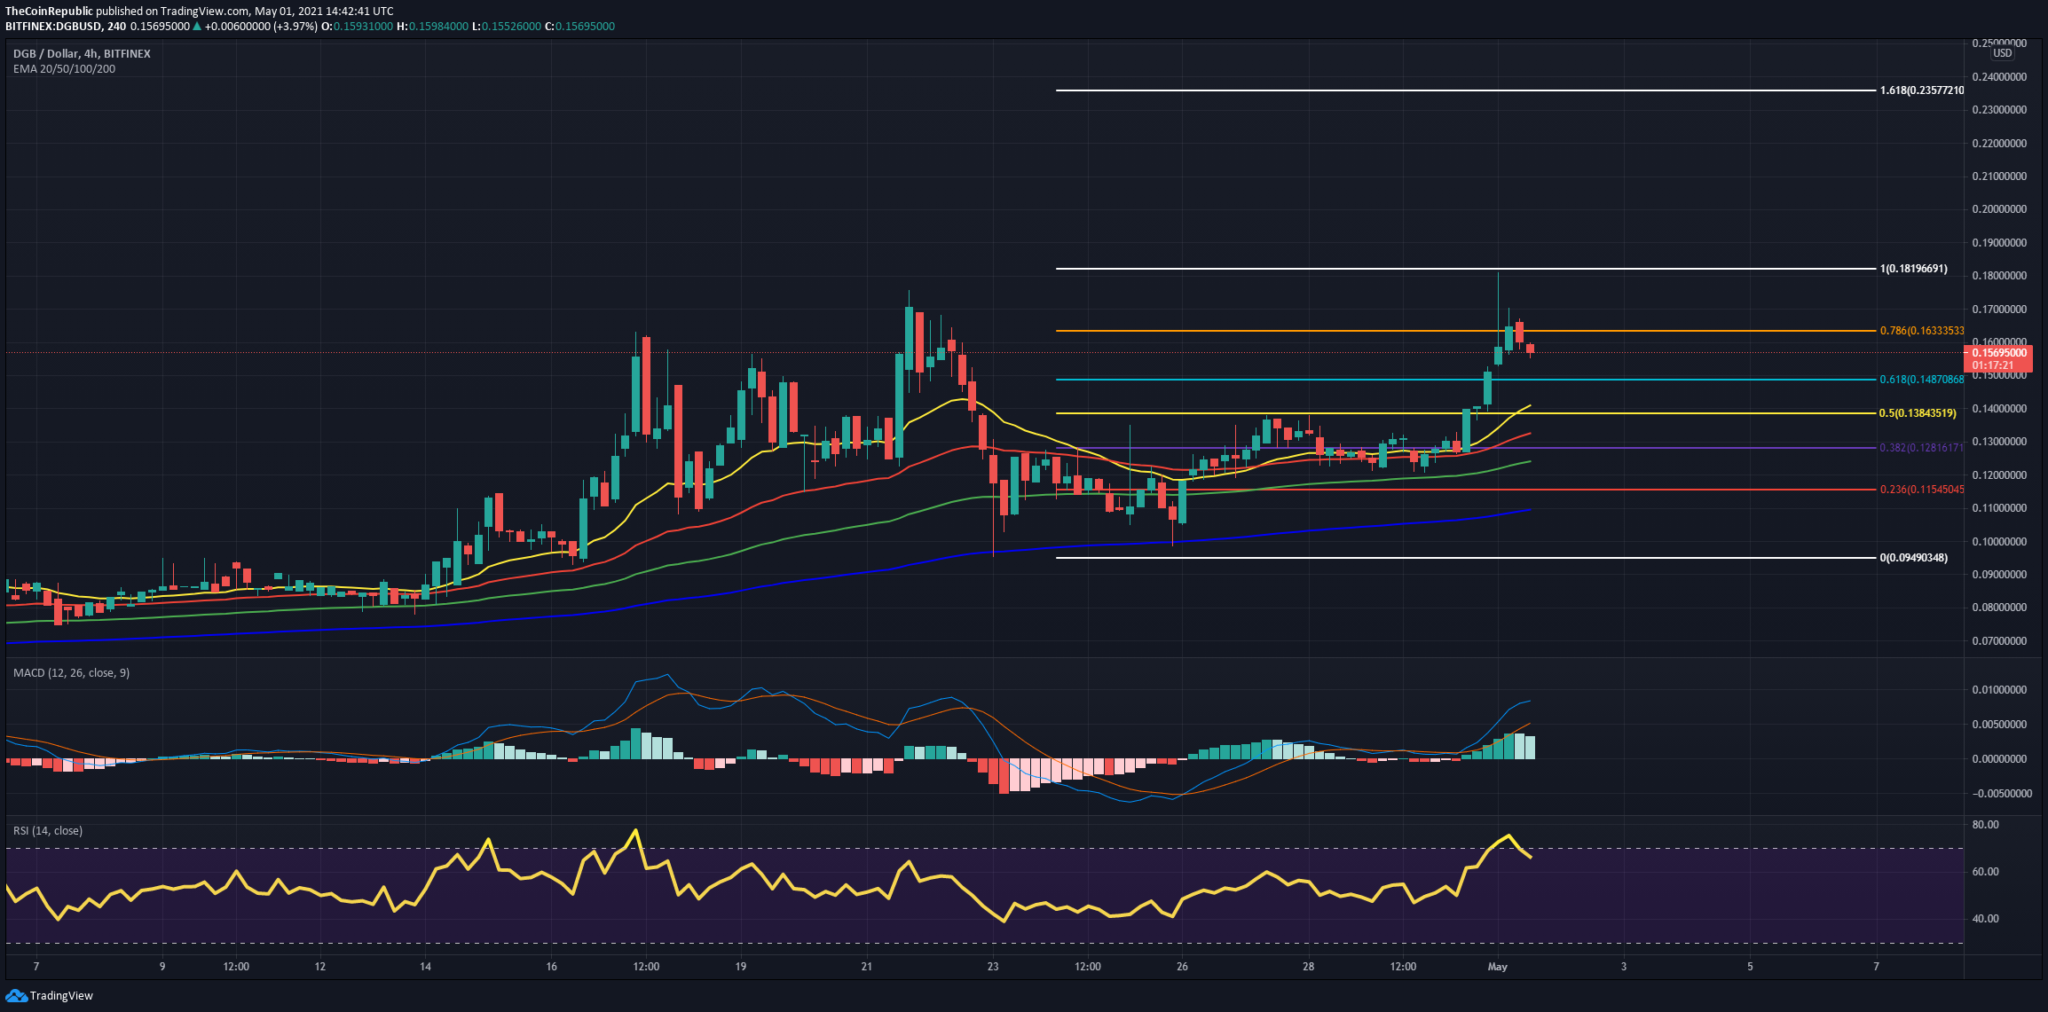
When we look at the chart from a technical perspective, DGB witnessed a minor sell-off because the price couldn’t sustain above the level of $0.16 (FIB 0.786 ).
It is anticipated that the price will descend and touch the support of $0.13(FIB 0.5) and bounce back at that particular range. If the price cannot hold that level, it would act as a key resistance zone.
At present, DGB price hovers above its key EMAs, where a bullish crossover between the 20 and 50 EMA acted as a major catalyst in pushing the price.
The current price is way above the major EMA levels, indicating that the price will eventually come down to let these EMAs catch up.
After being in the overbought territory for hours, the RSI has cooled off and is currently stable in the range of 64. Even though this is not necessarily overbought, the price will cool down further and step inside the equilibrium zone.
MACD line is above the signal line and is sitting wide apart, indicating no crossover sounds on the 4-hour chart.
CONCLUSION: A close above the 0.16 ( FIB 0.786) would most likely expose the price to new highs. However, a bounce on the $0.13 level is necessary before the price hikes to smash new ATHs. After a surge of 42% in two days, a small pullback is imminent and also depicts a healthy trend. The DGB and LCX partnership will enable them to leverage technological and legal infrastructure as part of the next step for the DGB ecosystem.
SUPPORT : $0.13 ( FIB 0.786)
RESISTANCE : $0.18
 thecoinrepublic.com