- UNI Token Price is at $40.27 with a 2.15% loss, on Saturday’s trading session
- The 24-hour volume in Uniswap is at $971,010,868, with a 3.60% increase
- The UNI/BTC pair was trading at 0.0006903 BTC with a loss of 8.21%
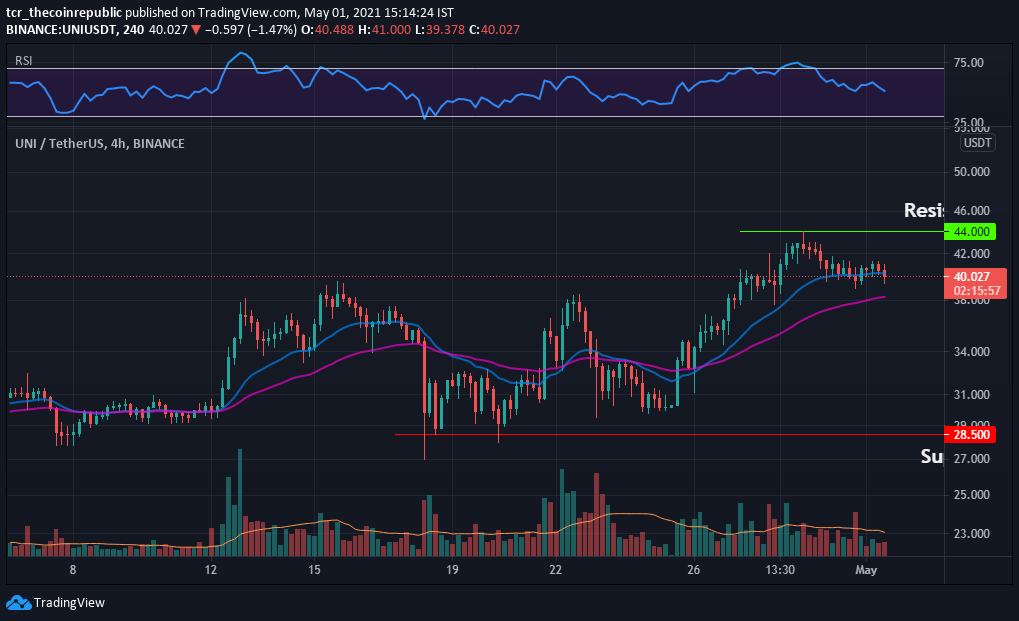
The 4-hour technical chart of UNI token price forecasts a downtrend. According to pivot points, UNI’s critical support level is placed at $28.50. Whereas if it moves up, the key resistance level to watch is $44.0. While diving into the weekly chart of a 4-hour time frame, it completes a dark cloud cover candlestick pattern representing bearish reversal with low reliability.
EMA- (20,50) acts as another strong support in the coin. EMA-20 (blue) intersects above EMA-50 (purple), which projects a positive trend for a short while. The price plunged below EMA-20 (blue). Investors may perceive a positive crossover in the EMA, and the price will also follow the positive trend.
RSI indicator (BEARISH), with a value of 49.50, indicates a sell signal in the coin. Moreover, Investors can see a downward slope from 75 to 49 in the index, and it may plunge in future trading sessions.
The volume of (409.31K) is below the Volume MA (841.27K) of 20-days. Selling pressure has begun in Uniswap to drive its price to lower levels.
Uniswap (UNI) Token Price Action Projects Bearish Trend
UNI token price traded at $40.27 with a loss of 3.70% in the last 24-hour and 23.40% up in the weekly time frame. Furthermore, UNI plunged from the resistance of $44.0. In contrast, the market capitalization stands at $20 billion. Technically, investors can perceive a positive crossover in the EMA, and the price is below the EMA-20. RSI index showcases a downward slope. Moreover, the price movement can be towards the support of $28.50 in future trading sessions.
Resistance: $44.0
Support: $28.50