In this article, we will take a look at the price movement for both Zcash (ZEC) and Dash (DASH) in order to determine their potential for increases in the month of May
ZEC has been rejected by a long-term resistance level at $300 but is expected to make another breakout attempt.
DASH has reclaimed the $185 area, validating it as support. It is expected to continue moving higher.
ZEC
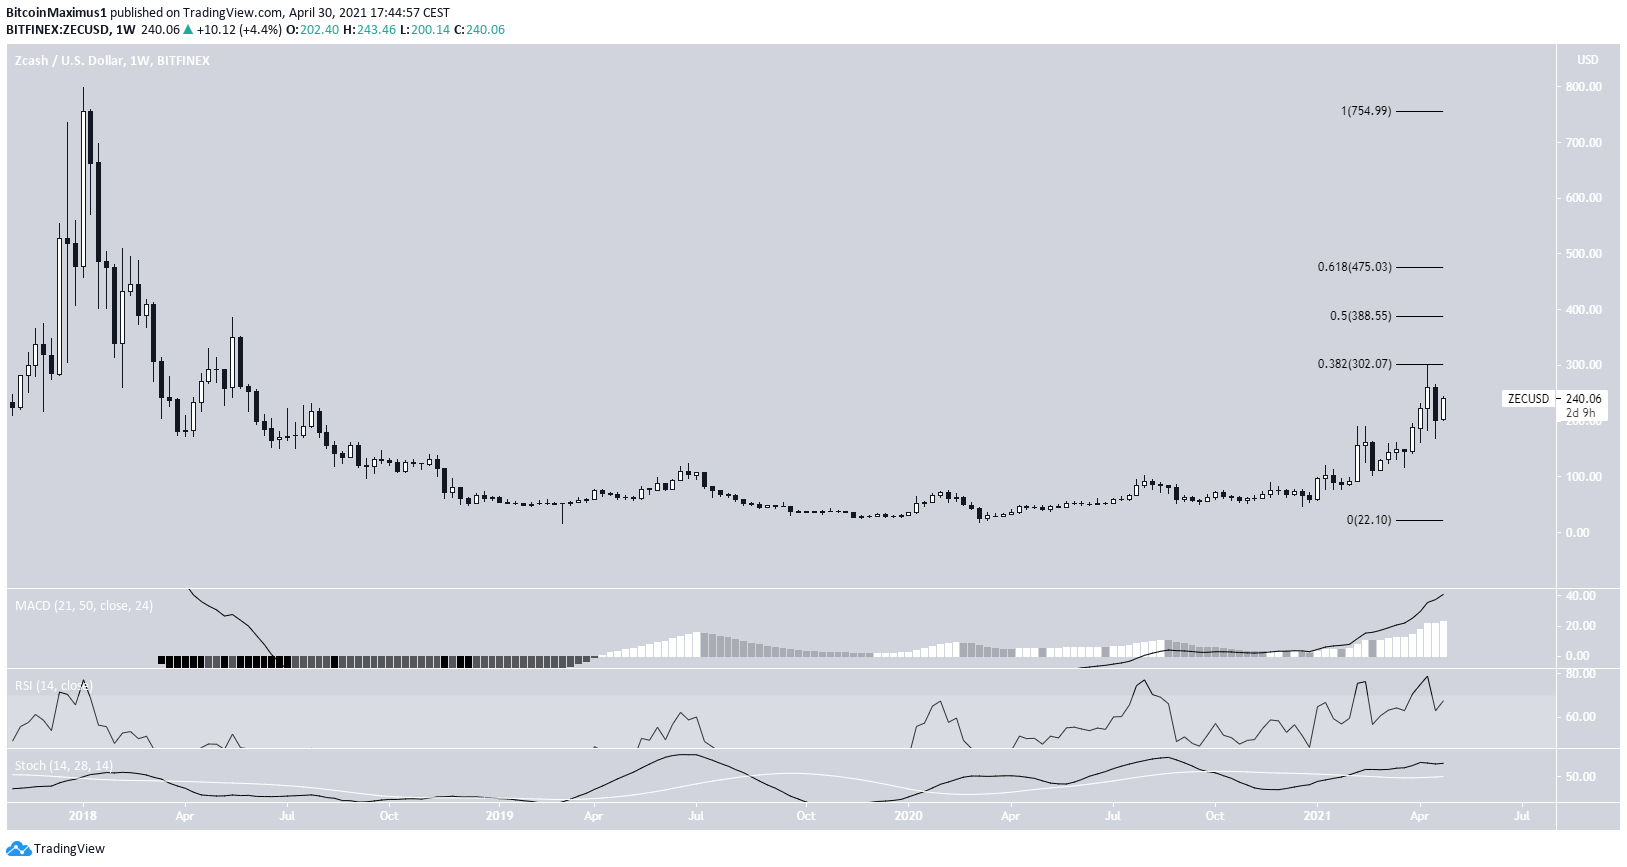
ZEC has been increasing since the beginning of the year. The increase continued until April 17, then the token managed to reach a high of $299. The high was made very close to the 0.382 Fib retracement level when measuring from the all-time high price.
The following week, the price was rejected and created a bearish engulfing candlestick.
Despite the drop, the MACD & Stochastic oscillator are still bullish. This indicates that the long-term trend is also bullish.
The next closest resistance levels are found at $388 and $457. These areas are found by the 0.5 and 0.618 Fib retracement levels, respectively.
Therefore, despite the ongoing increase, ZEC is not even close to reaching its all-time high price yet.
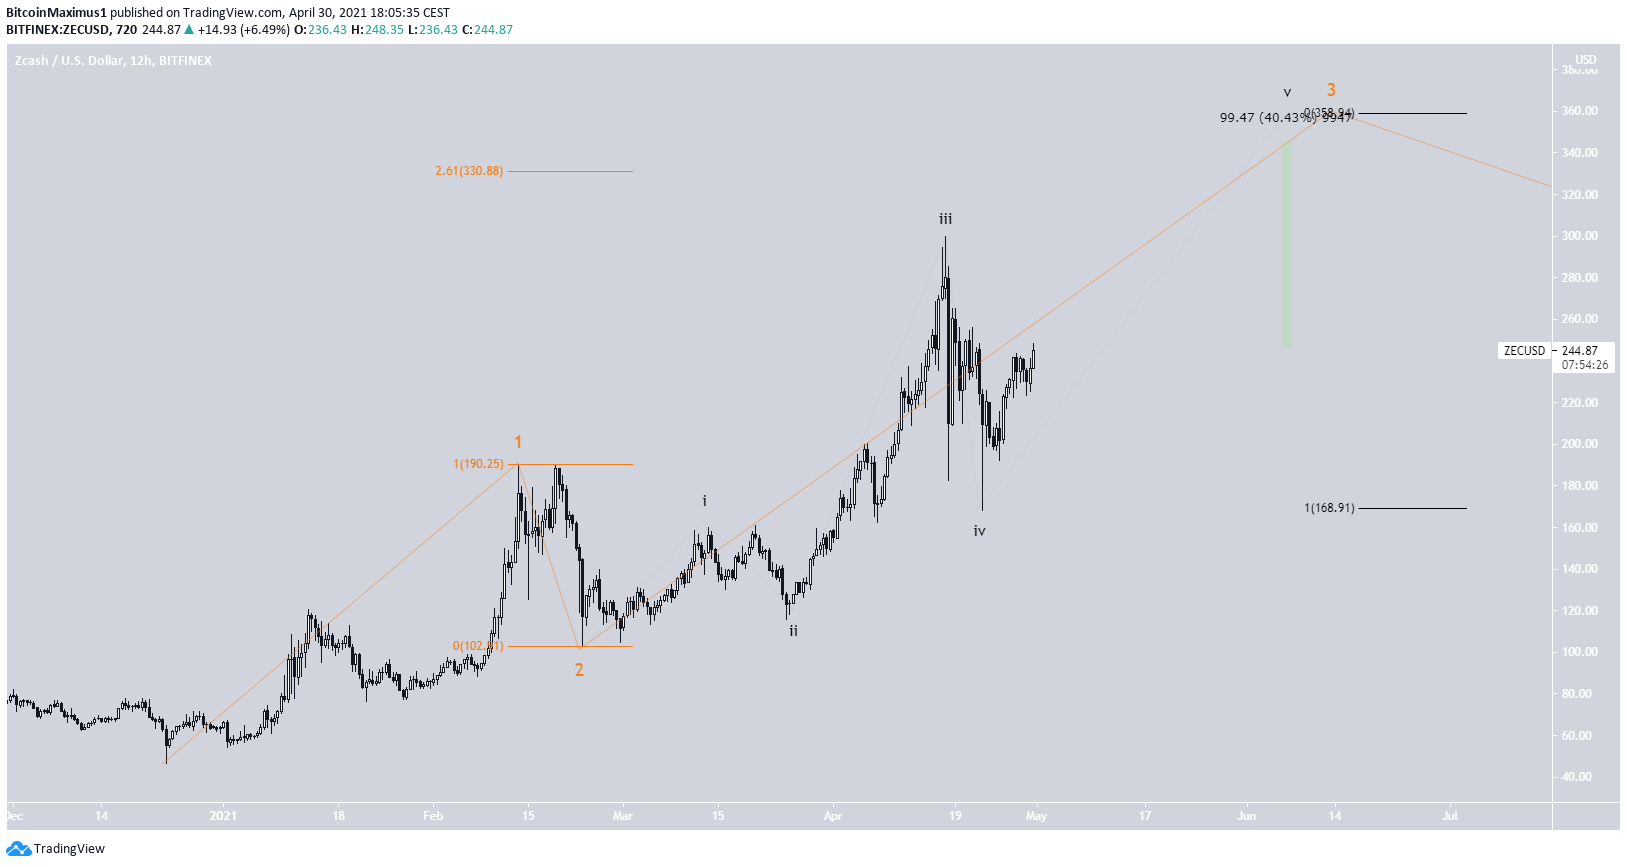
The wave count suggests that ZEC is in sub-wave five (black) of wave three (orange).
A potential target for the top of the movement is located between $330-360. It is found using an external retracement on wave two (orange) and Fib projection on sub-waves 1-3 (black).
Measuring from the current price, the average between these two targets would amount to an upward movement of 40%.
DASH
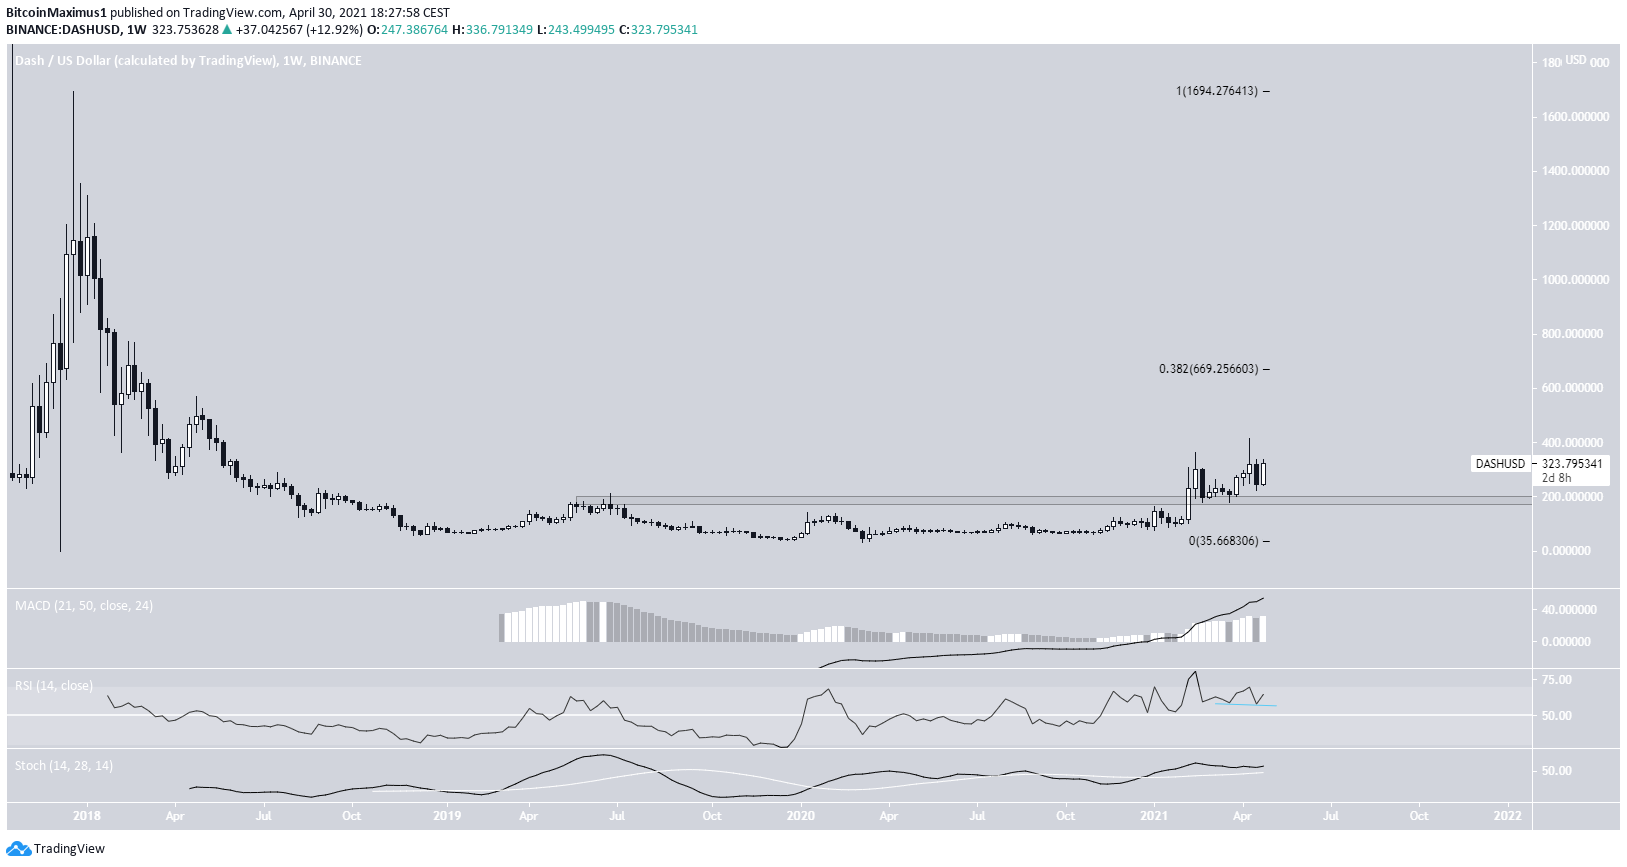
Similarly to ZEC, DASH has also been moving upwards since the beginning of the year. However, it has yet to even come close to the 0.382 Fib retracement resistance, which is found at $667.
So far, it has managed to reach a high of $415.
Despite this lack of strength, DASH has managed to break out from and validate the $185 area as support. This was an important horizontal resistance level that had been in place since May 2019.
Furthermore, technical indicators are bullish. In addition, the RSI has generated hidden bullish divergence, a strong sign of trend continuation.
Therefore, it is likely that it continues increasing and eventually reaches the $667 resistance area.
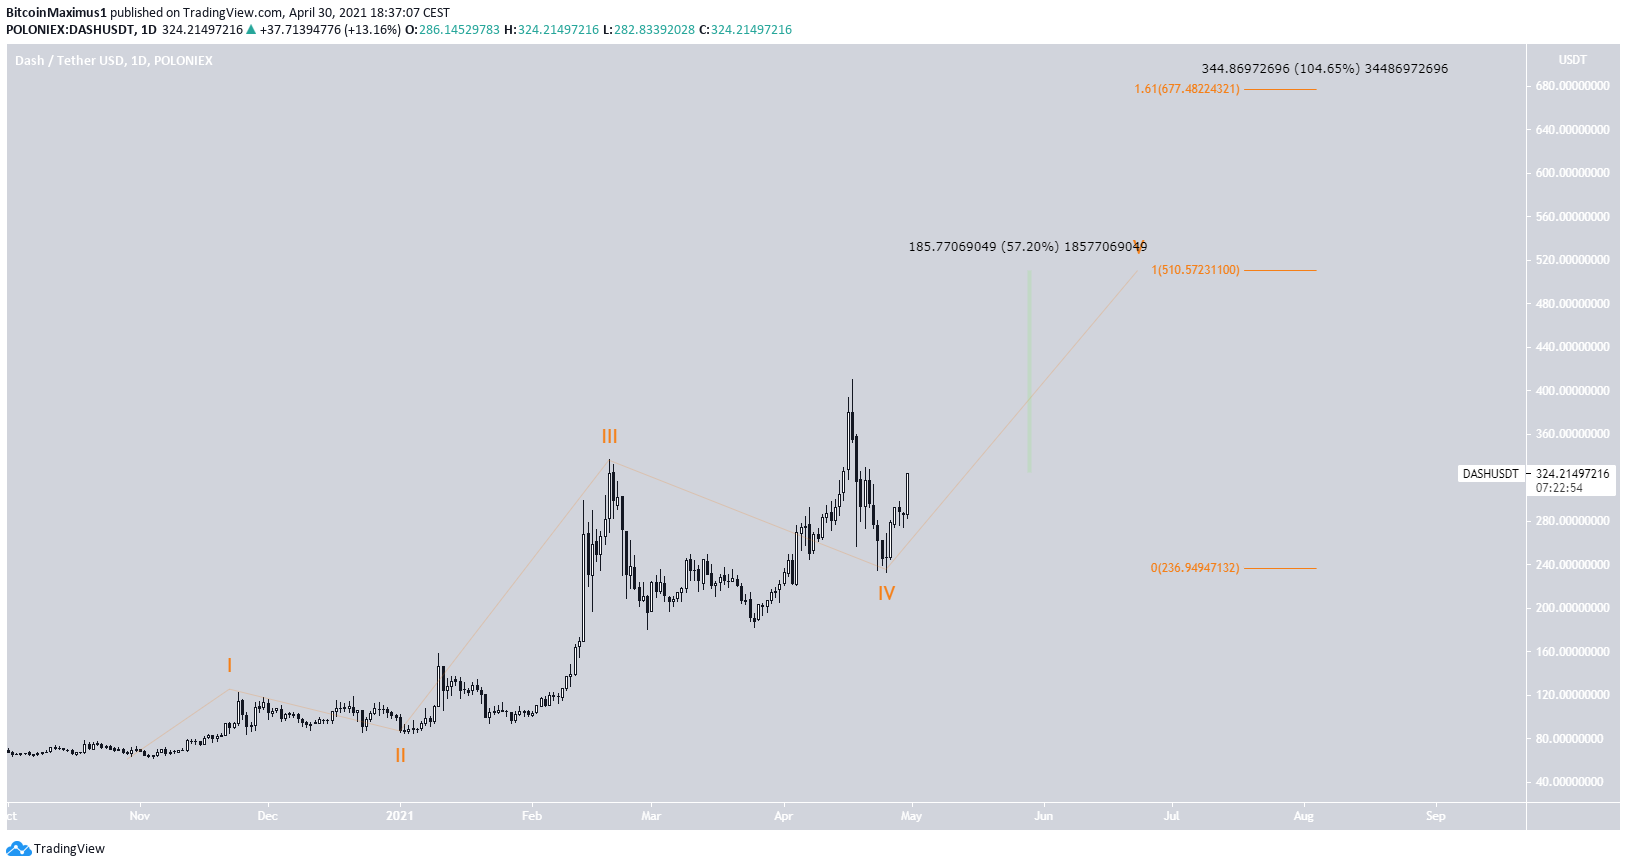
The wave count suggests that DASH has just completed a running flat correction as part of wave four.
The two most likely targets for the top of the upward movement are found at $510 and $677. While the latter would only occur if wave five extends, it has confluence with the previously outlined long-term resistance level.
Measuring from the current price, the targets would amount to upward movements of 57% and 104%, respectively.