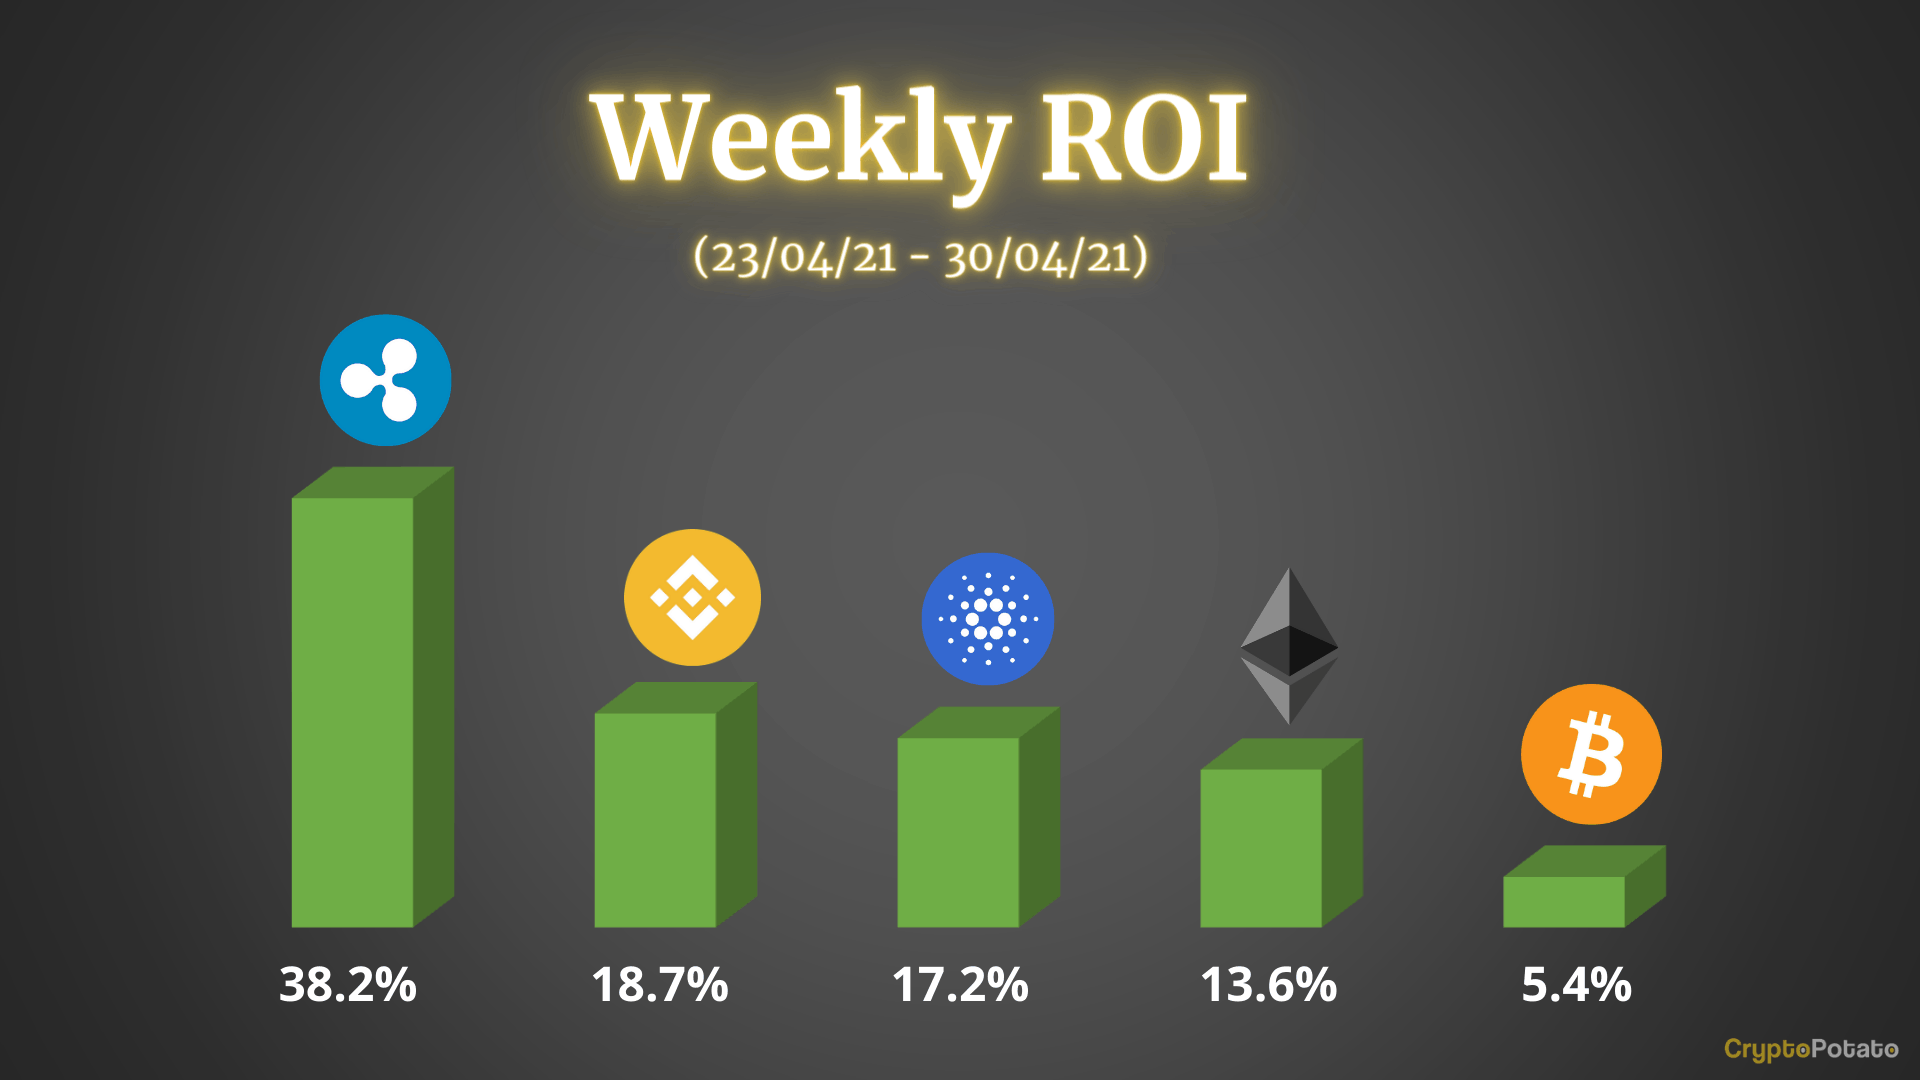
The crypto market recovered this week, but bitcoin seems unable to catch up with the momentum that alts are currently getting. This is perfectly visible in the below chart, showing that large-cap altcoins outperformed it, dollar-wise, substantially.
Bitcoin
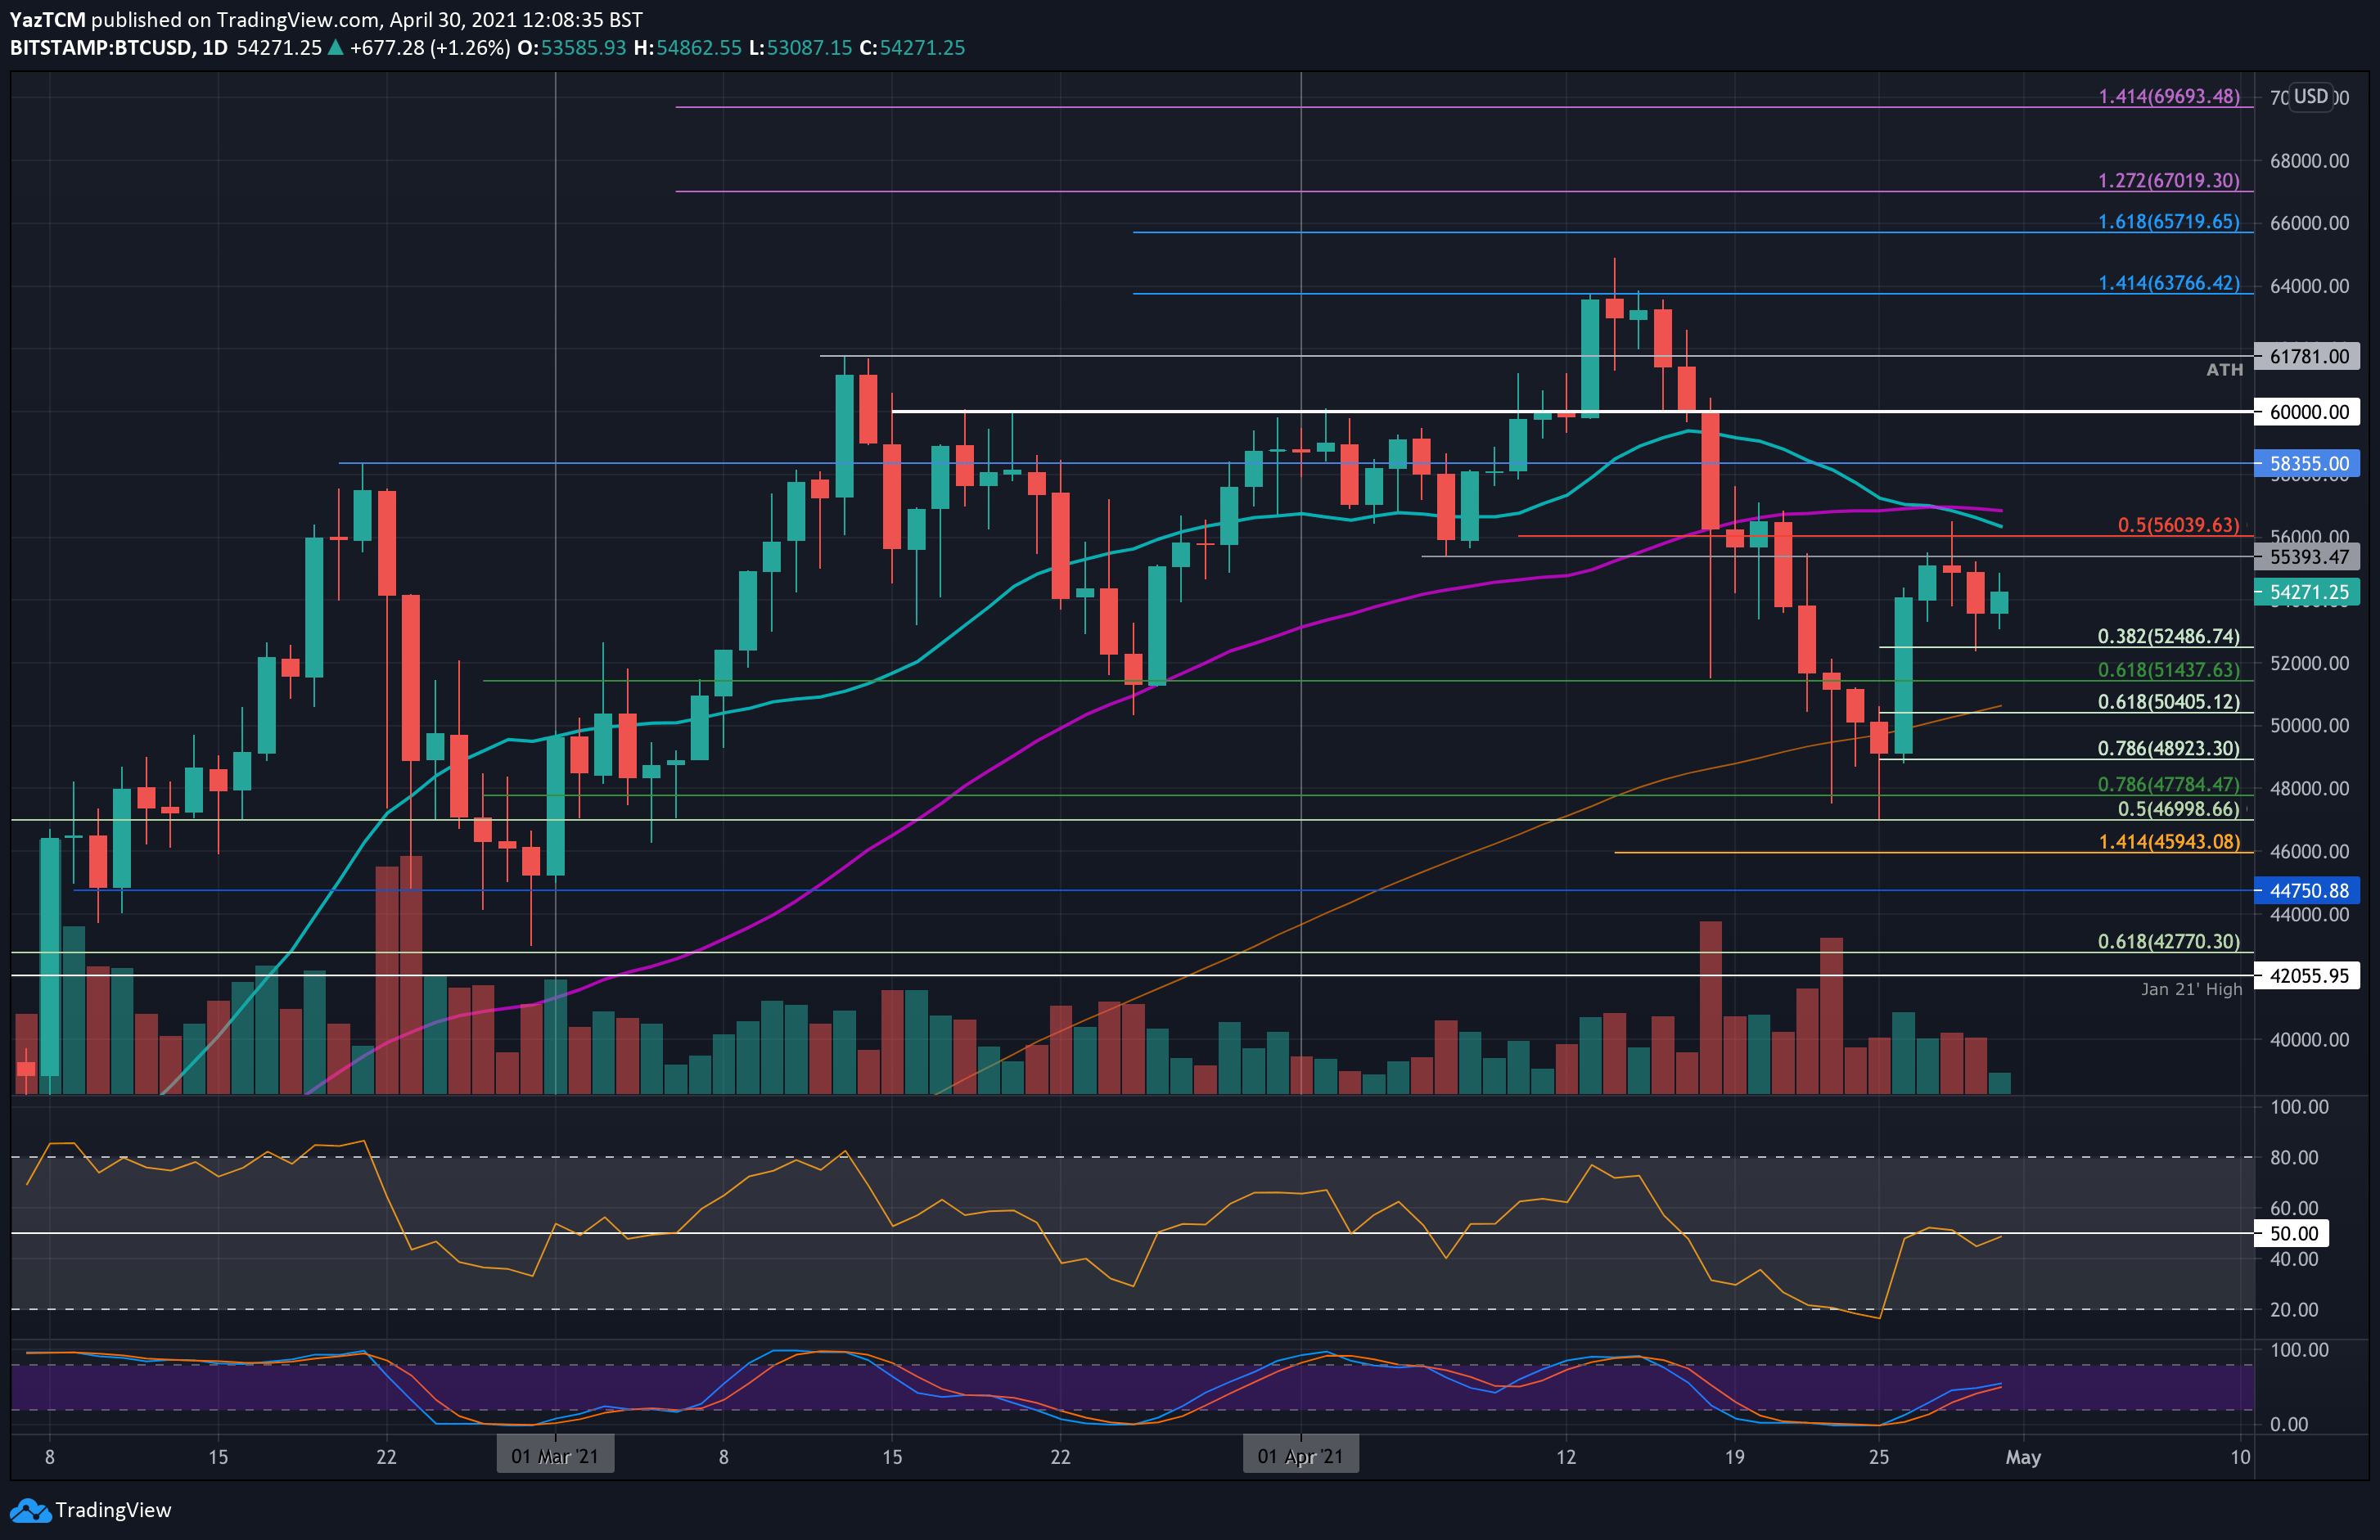
Bitcoin saw a small 5.4% price hike over the past seven days as it currently sits around $54,300. It found support at $47,000 (.5 Fib) on Sunday and rebounded from there to close the daily candle around $49,000.
On Monday, bitcoin rebounded as it pushed back above $50,000 to reach $54,000. The price rise continued on Tuesday and Wednesday, but Bitcoin was unable to close a daily candle above resistance at $55,400. It dropped lower from there yesterday until support was found at $52,486 (.382 Fib). It has since bounced higher to the current $54,300 price.
There is one worrying signal that was generated this week. The 20-days MA crossed beneath 50-days MA for the first time since October 2020, which might be the first signal for a short-term bearish trend.
Looking ahead, the first resistance lies at $55,400. This is followed by $56,040 (bearish .5 Fib & 20-days MA), $56,900 (50-days MA), $58,355, and $60,000.
On the other side, the first support lies at $52,486 (.382 Fib). This is followed by $51,340 (long term .618 Fib), $50,400 (100-days MA & .618 Fib), $50,000, and $48,920 (.786 Fib).
Ethereum
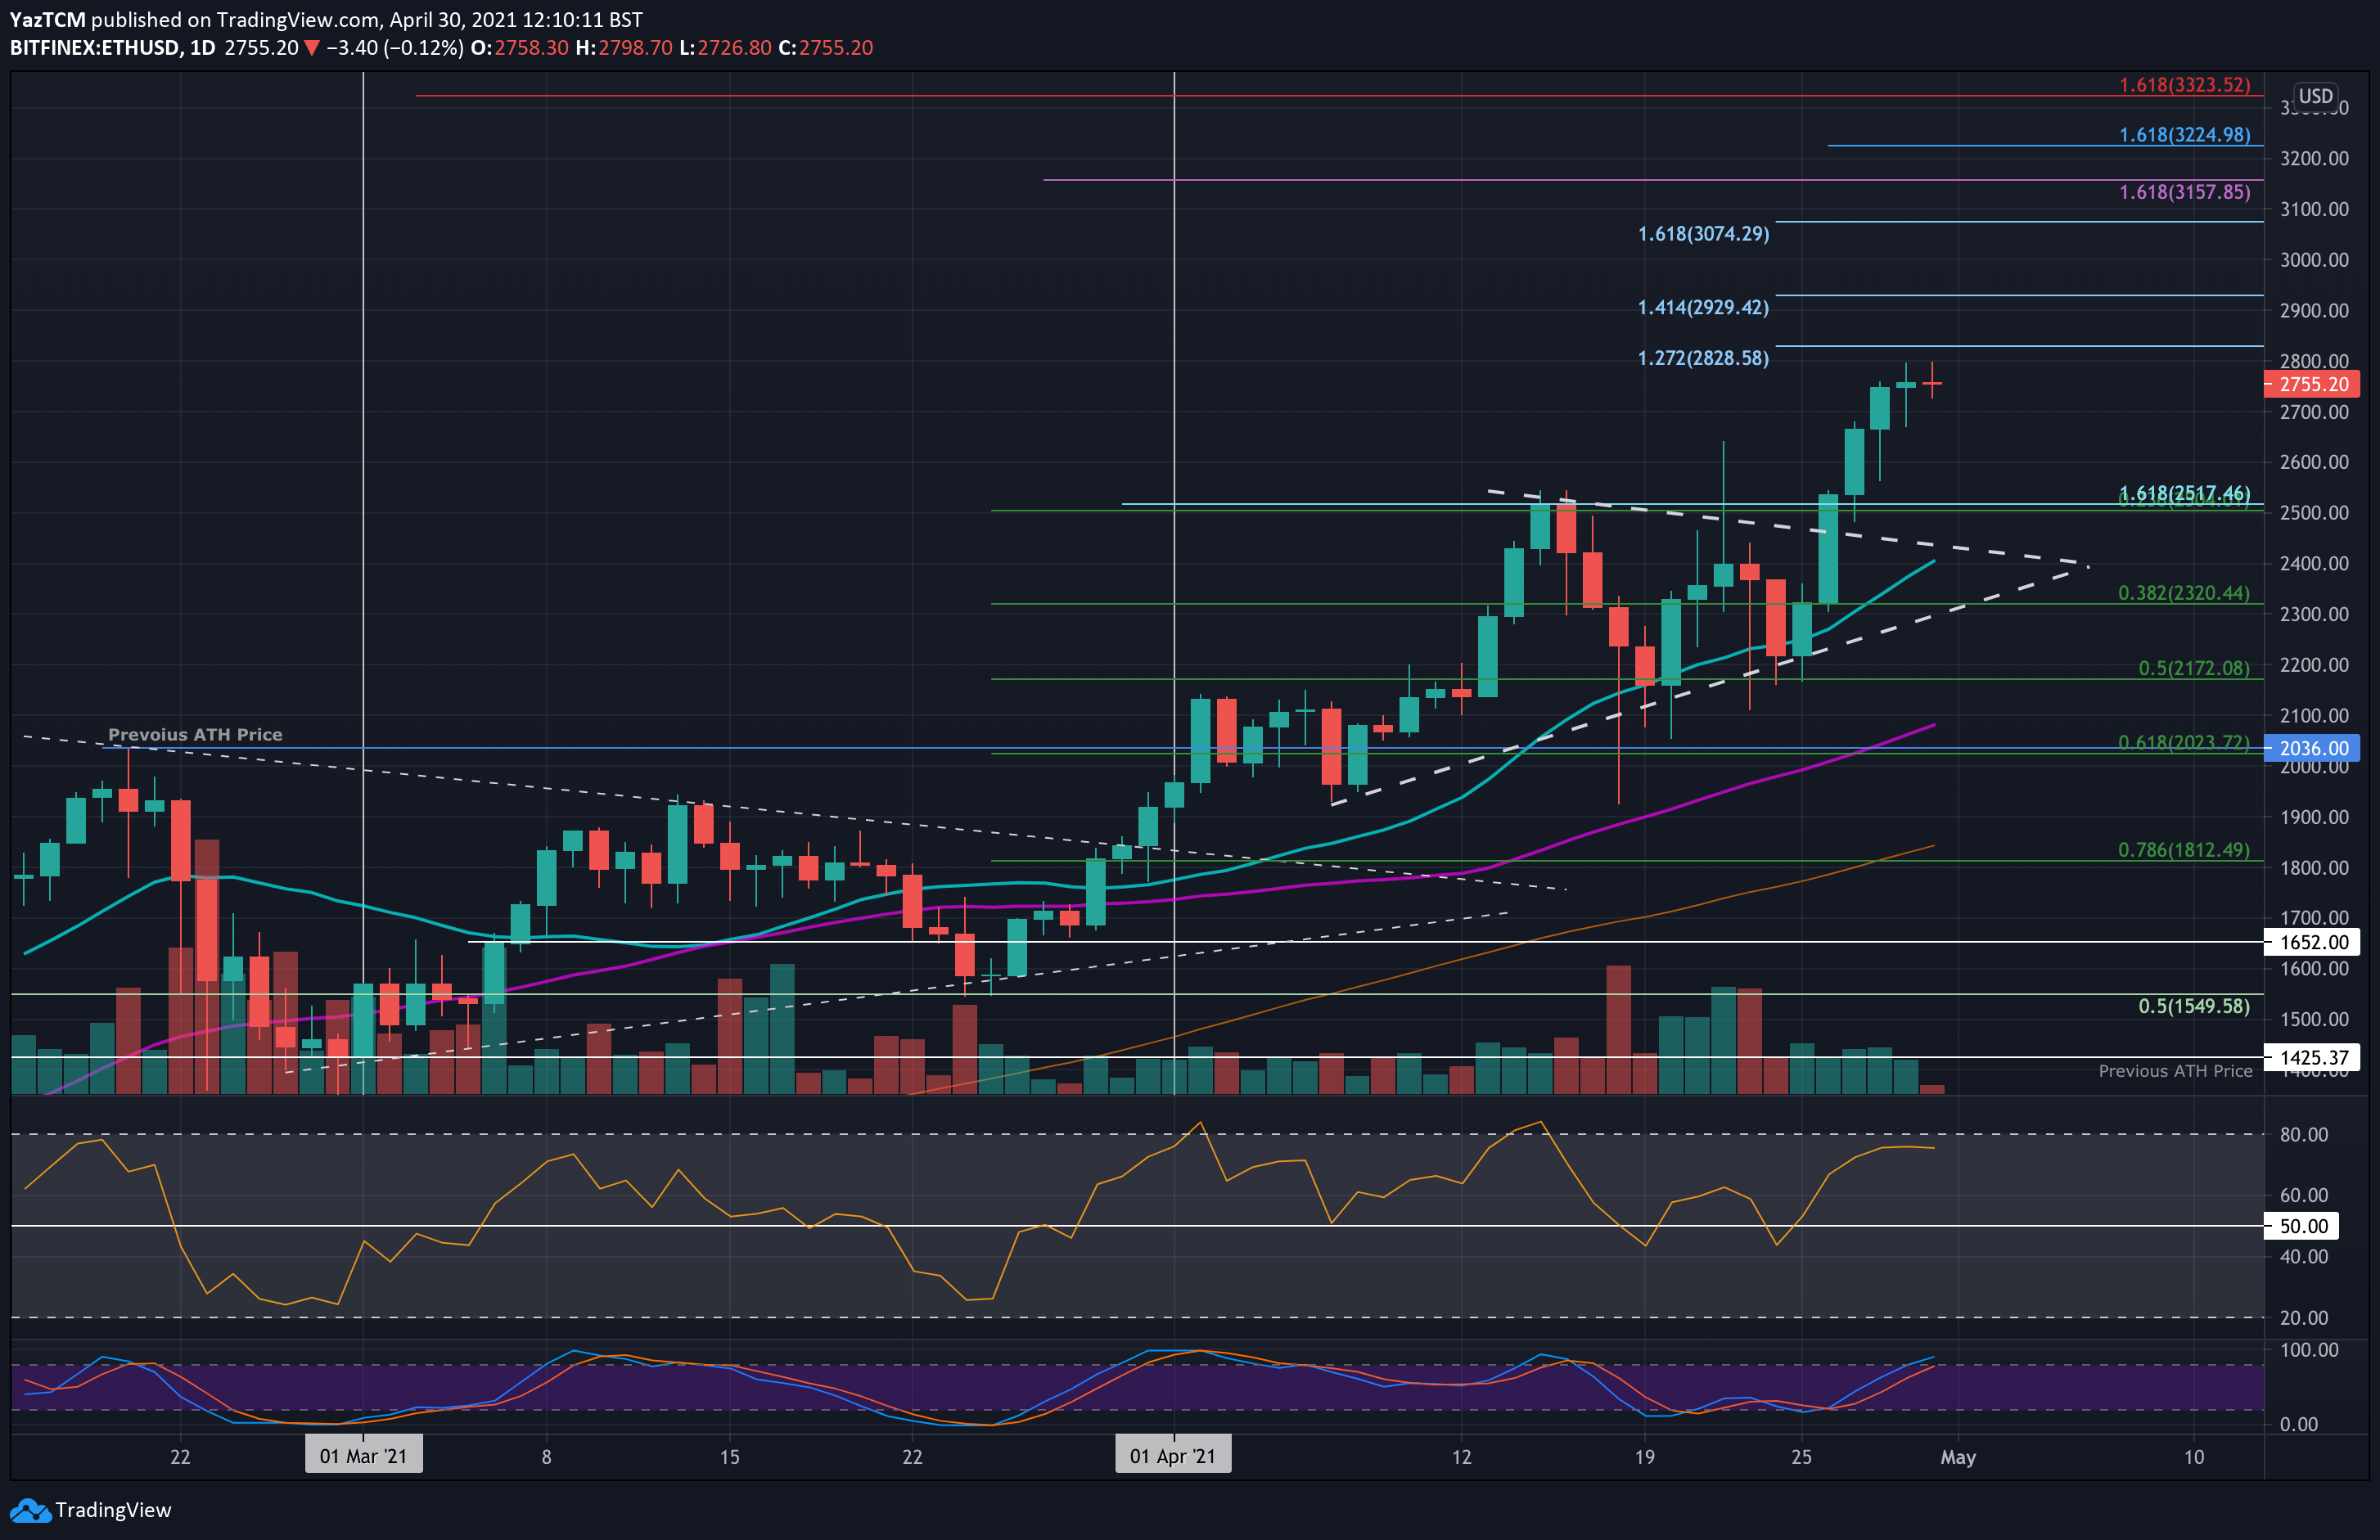
Ethereum saw a strong performance this week in which the price managed to rise by 13.6% as it hit the current $2755 level. ETH also printed a new ATH today at $2799. The cryptocurrency had started the week by bouncing from support at the lower boundary of a symmetrical triangle pattern that it was trading inside.
On Monday, etheruem managed to break toward the upside of this pattern as it continued to break $2500. The bullish run continued throughout the week as ETH made fresh ATH prices each day until reaching near $2800 today.
Looking ahead, the first support lies at $2600. This is followed by $2500 (.236 Fib), $2400 (20-days MA), $2320 (.382 Fib), and $2172 (.5 Fib).
On the other side, if the bulls break $2800, the first resistance lies at $2929 (1.272 Fib Extension). This is followed by $2929 (1.313 Fib Extension), $3000, $3075 (1.618 Fib Extension), and $3157.
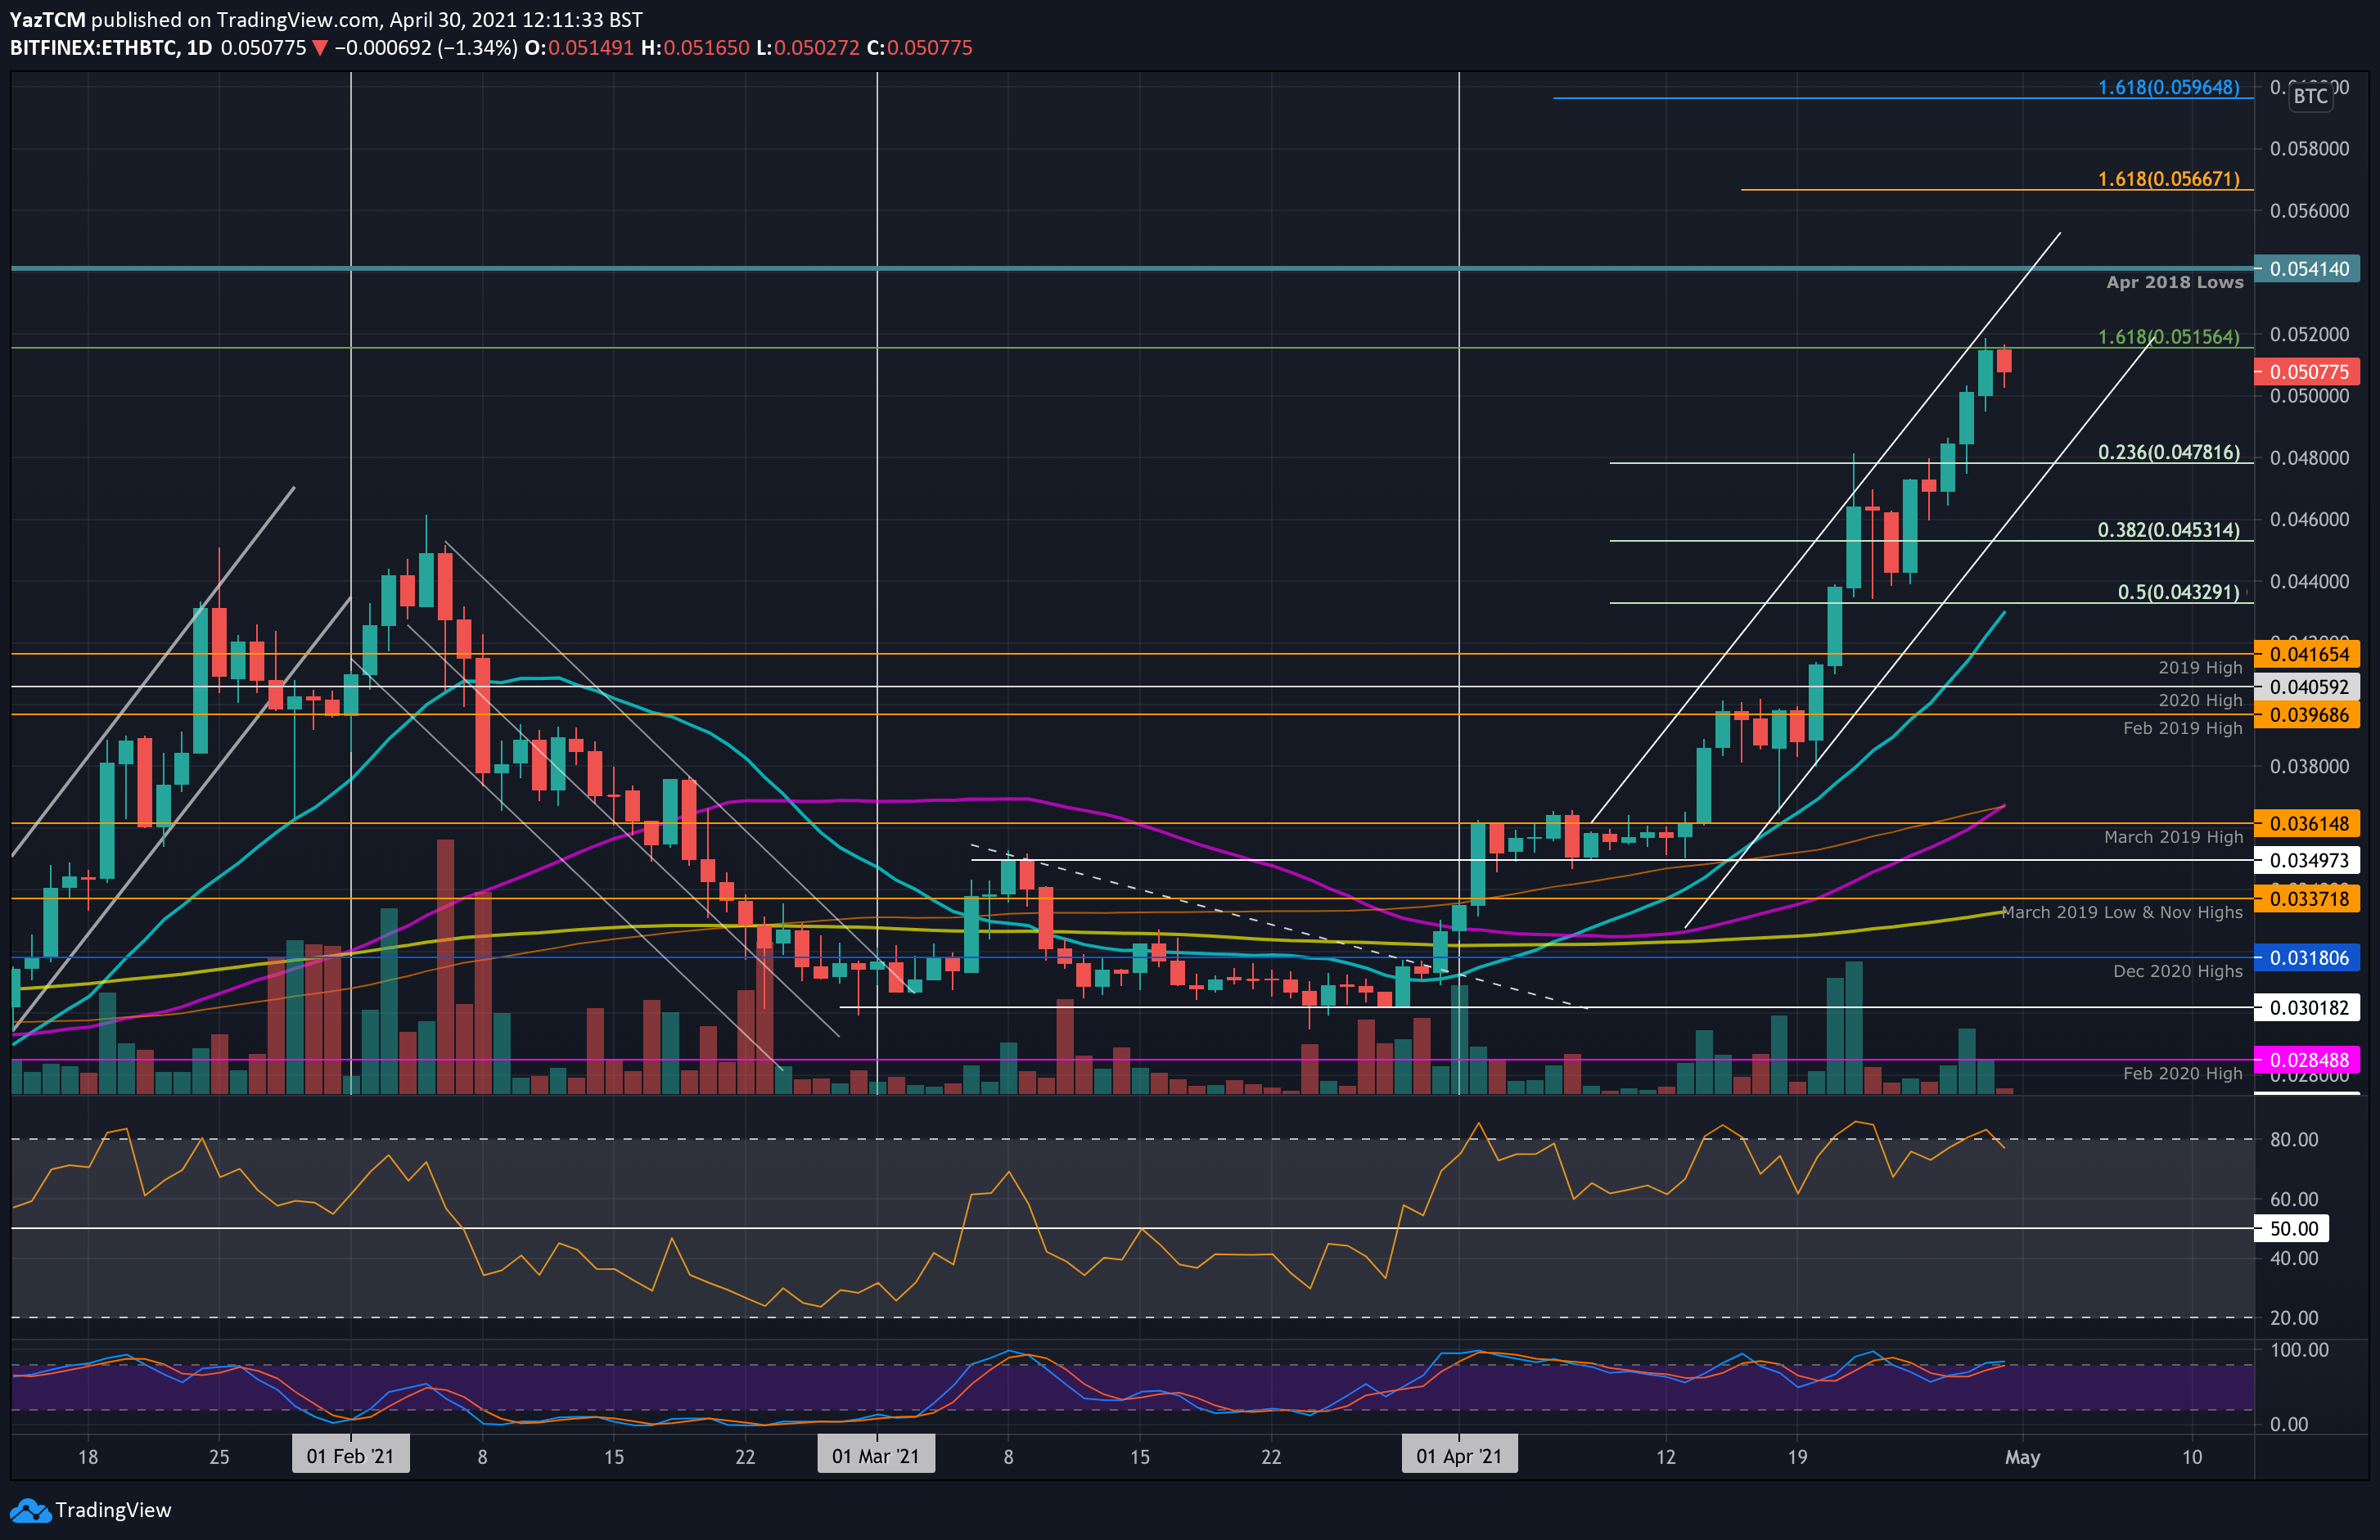
ETH is performing remarkably well against bitcoin as it reaches prices not seen since March 2018 this week. The coin was trading around 0.044 BTC over the weekend as it started to push higher.
As the week progressed, ethereum continued to climb into fresh yearly highs until it met resistance at 0.0515 BTC (1.618 Fib Extension) yesterday. It was unable to close above this resistance and has since dropped to the current 0.0507 BTC price.
Looking ahead, the first support lies at 0.05 BTC. This is followed by 0.0478 BTC (.236 Fib), 0.0465 BTC (price channel support), 0.0453 (.382 Fib), and 0.0432 (.5 Fib & 20-days MA).
On the other side, the first resistance lies at 0.0515 BTC (1.618 Fib Extension). Beyond 0.052 BTC, resistance lies at 0.0541 BTC (April 2018 lows), 0.055 BTC, 0.0566 BTC (1.618 Fib Extension), and 0.058 BTC.
Ripple
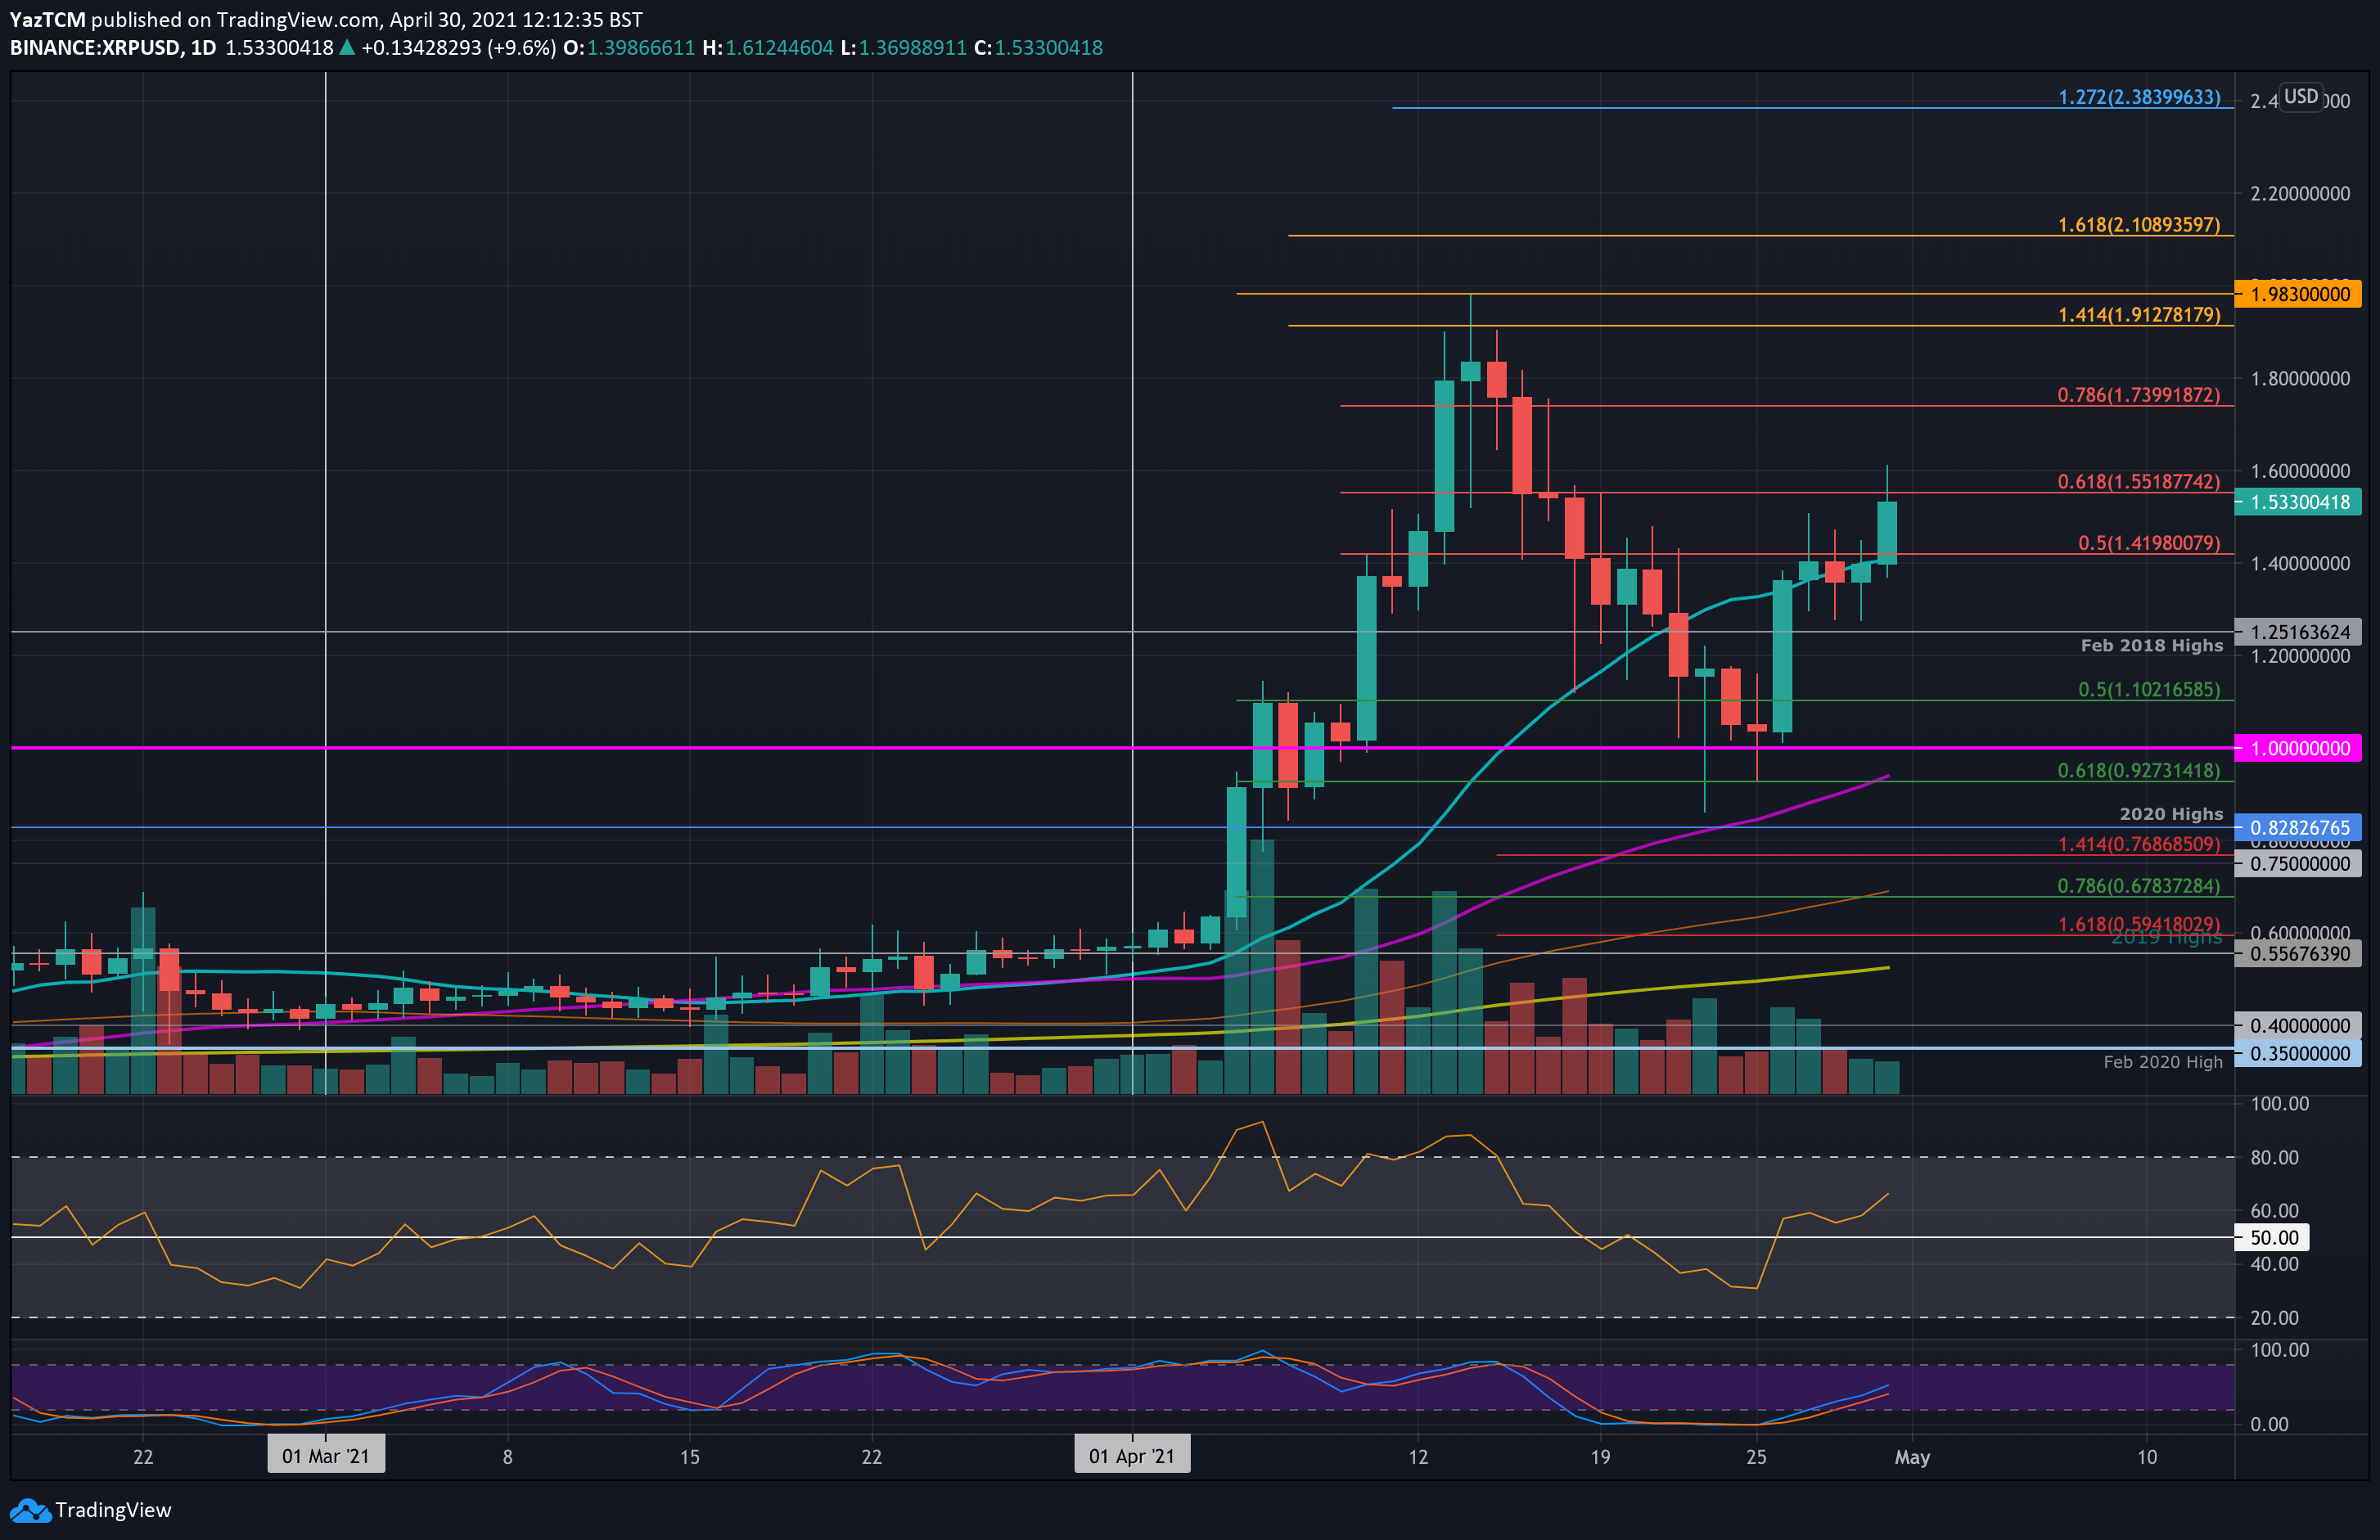
XRP saw a solid 38% price hike this week as it currently trades at $1.53. The cryptocurrency rebounded from support at $0.92 (.618 Fib) on Sunday and returned above $1.00 by the time the candle closed.
On Monday, XRP started to surge higher until resistance was found at $1.42 (bearish .5 Fib) on Tuesday. This resistance was not penetrated until today when XRP surged as high as $1.60. It has dropped slightly as it attempts to tackle the resistance at $1.55, provided by a bearish .618 Fib.
Moving forward, the first resistance above $1.60 lies at $1.74 (bearish .786 Fib). This is followed by $1.98 (April Highs), $2.10 (1.618 Fib Extension), $2.25, and $2.38 (1.272 Fib Extension).
On the other side, the first support lies at $1.40 (20-days MA). This is followed by $1.25 (Feb 2019 Highs), $1.10 (.5 Fib), $1.00, and $0.927 (.618 Fib & 50-days MA).
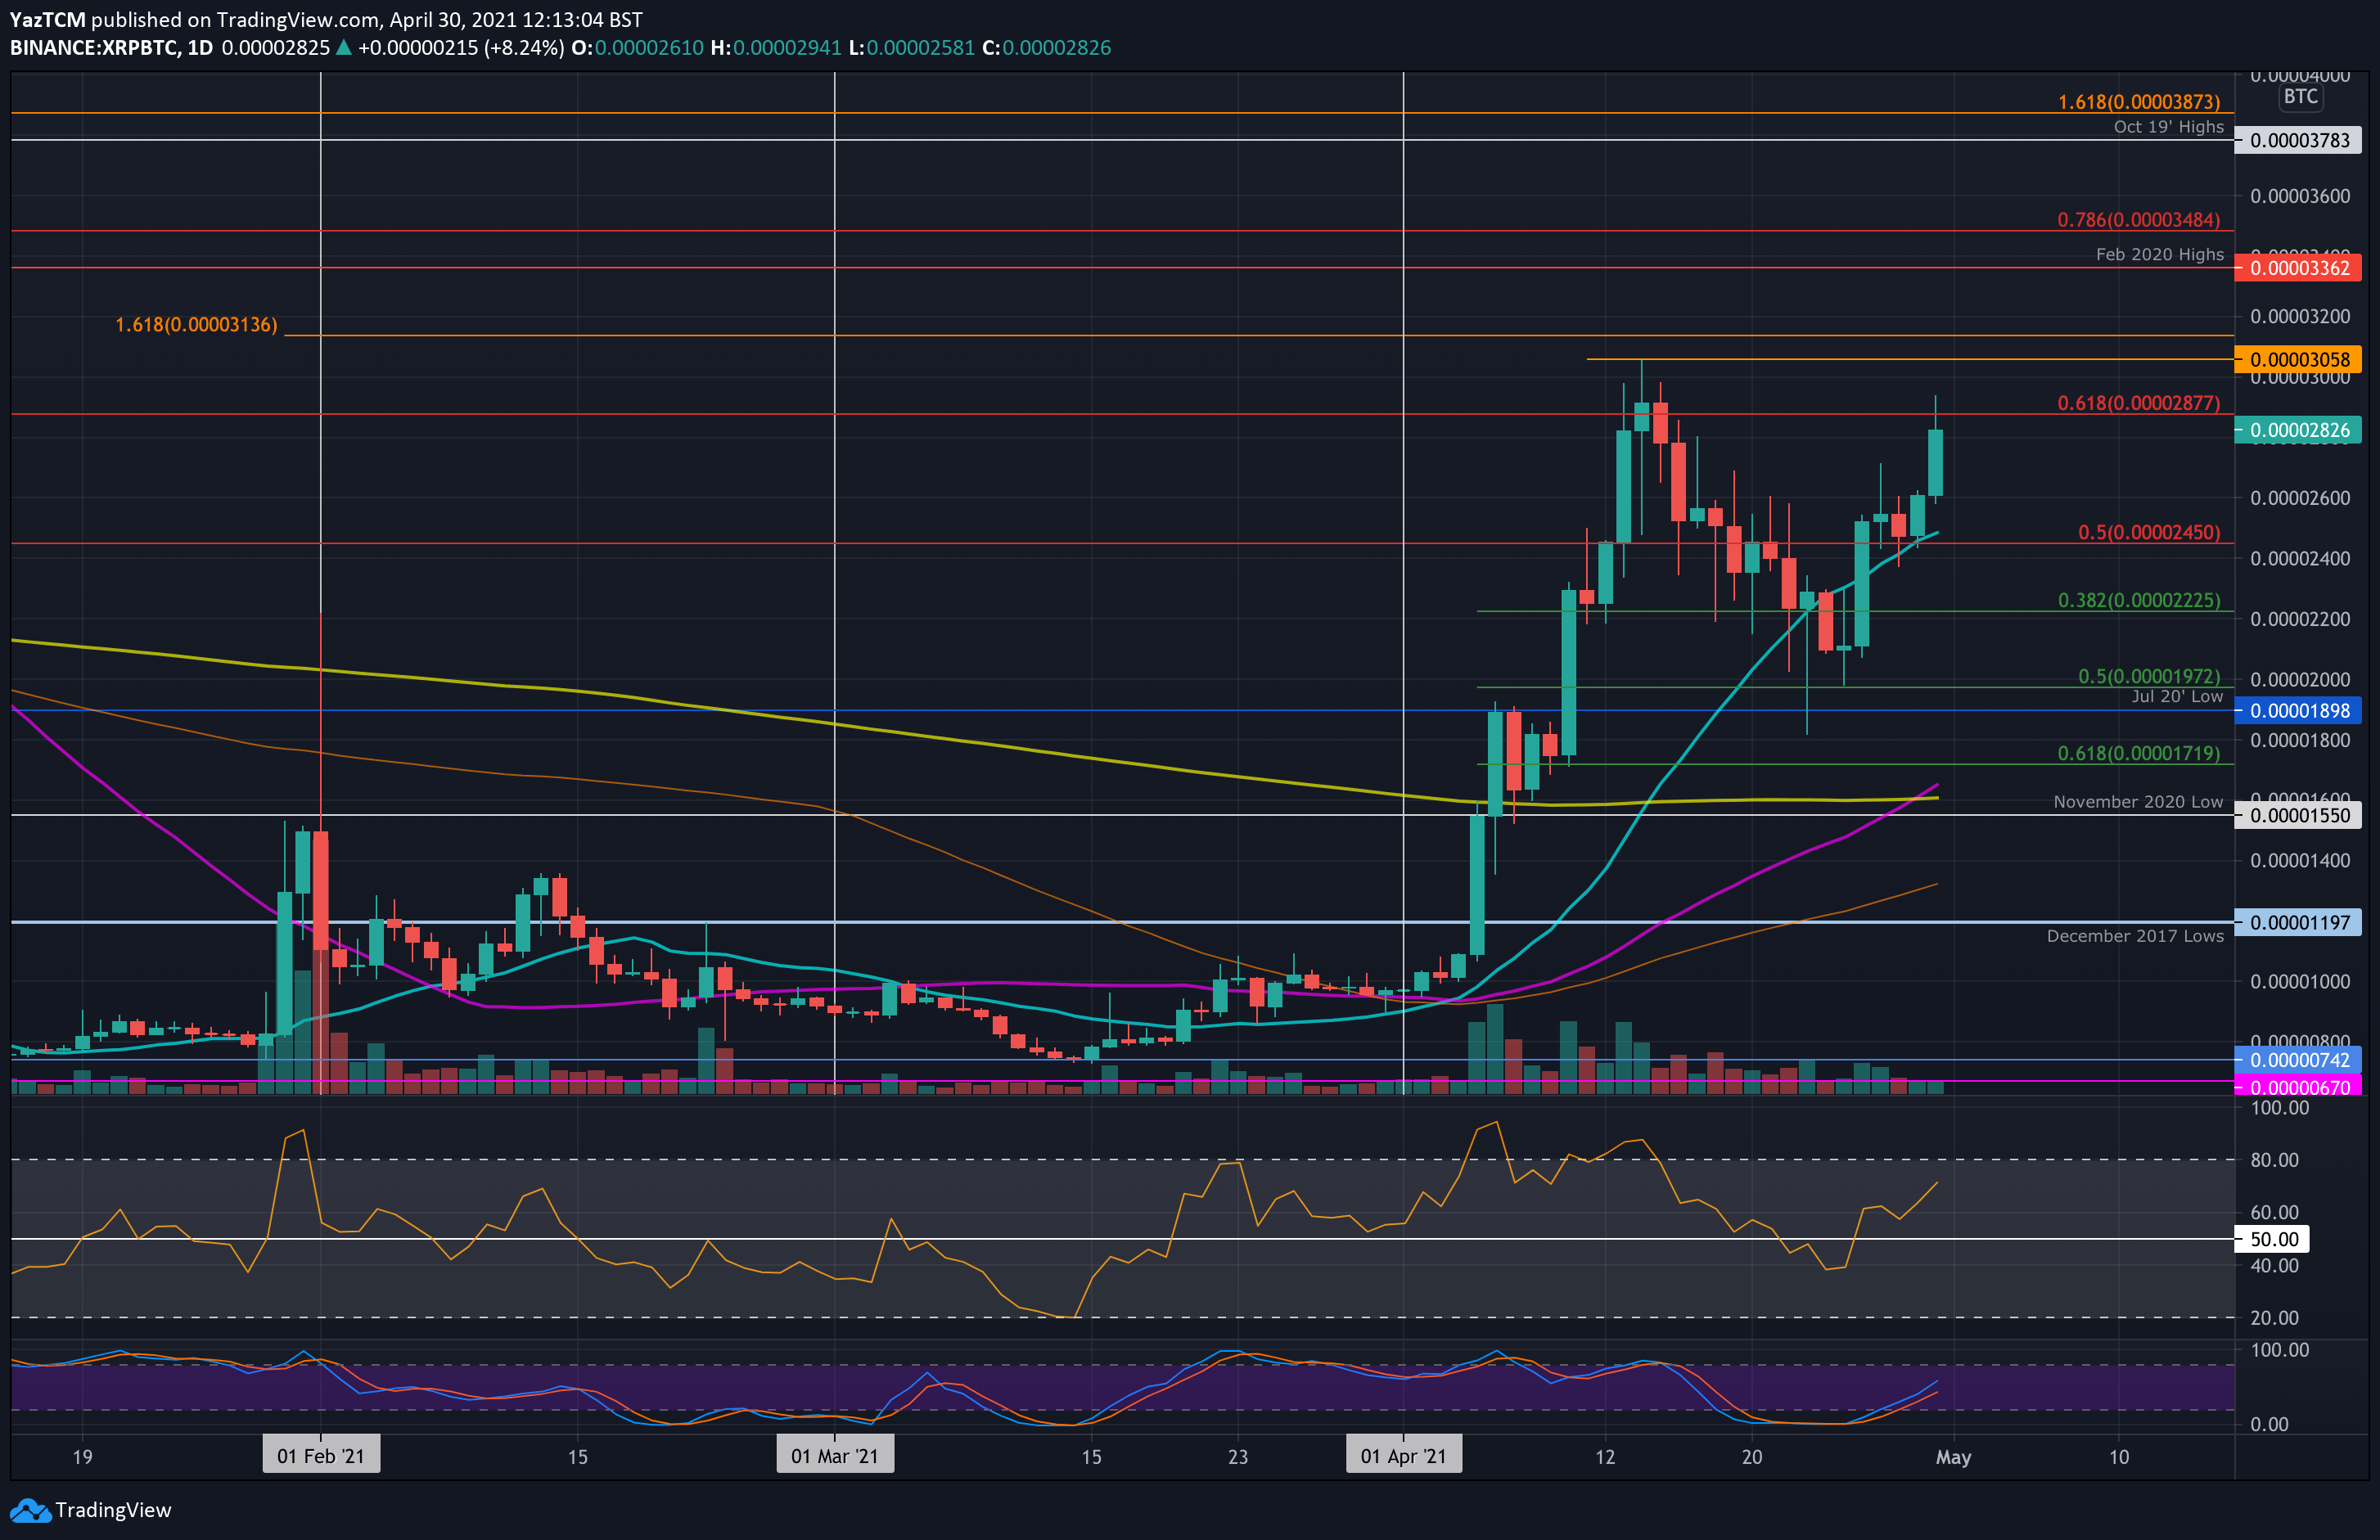
Against bitcoin, XRP found support at 1972 SAT (.5 Fib) on Sunday as it started to rebound higher. By Monday, XRP had reached above 2500 SAT but struggled with resistance at 2600 SAT as the week progressed.
2600 SAT was finally penetrated today as XRP pushed to 2940 SAT. It has since dropped and must close above resistance at 2877 SAT (.618 Fib) to continue higher.
Looking ahead, the first resistance above 2877 SAT lies at 3038 SAT (April highs). This is followed by 3200 SAT, 3362 SAT (Fen 2020 highs), 3485 SAT (bearish .786 Fib), and 3783 SAT (Oct 2019 Highs).
On the other side, the first support lies at 2600 SAT. This is followed by 2450 SAT (20-days MA), 2225 SAT (.382 Fib), 1900 SAT (July 2020 low), and 1719 SAT.
Cardano
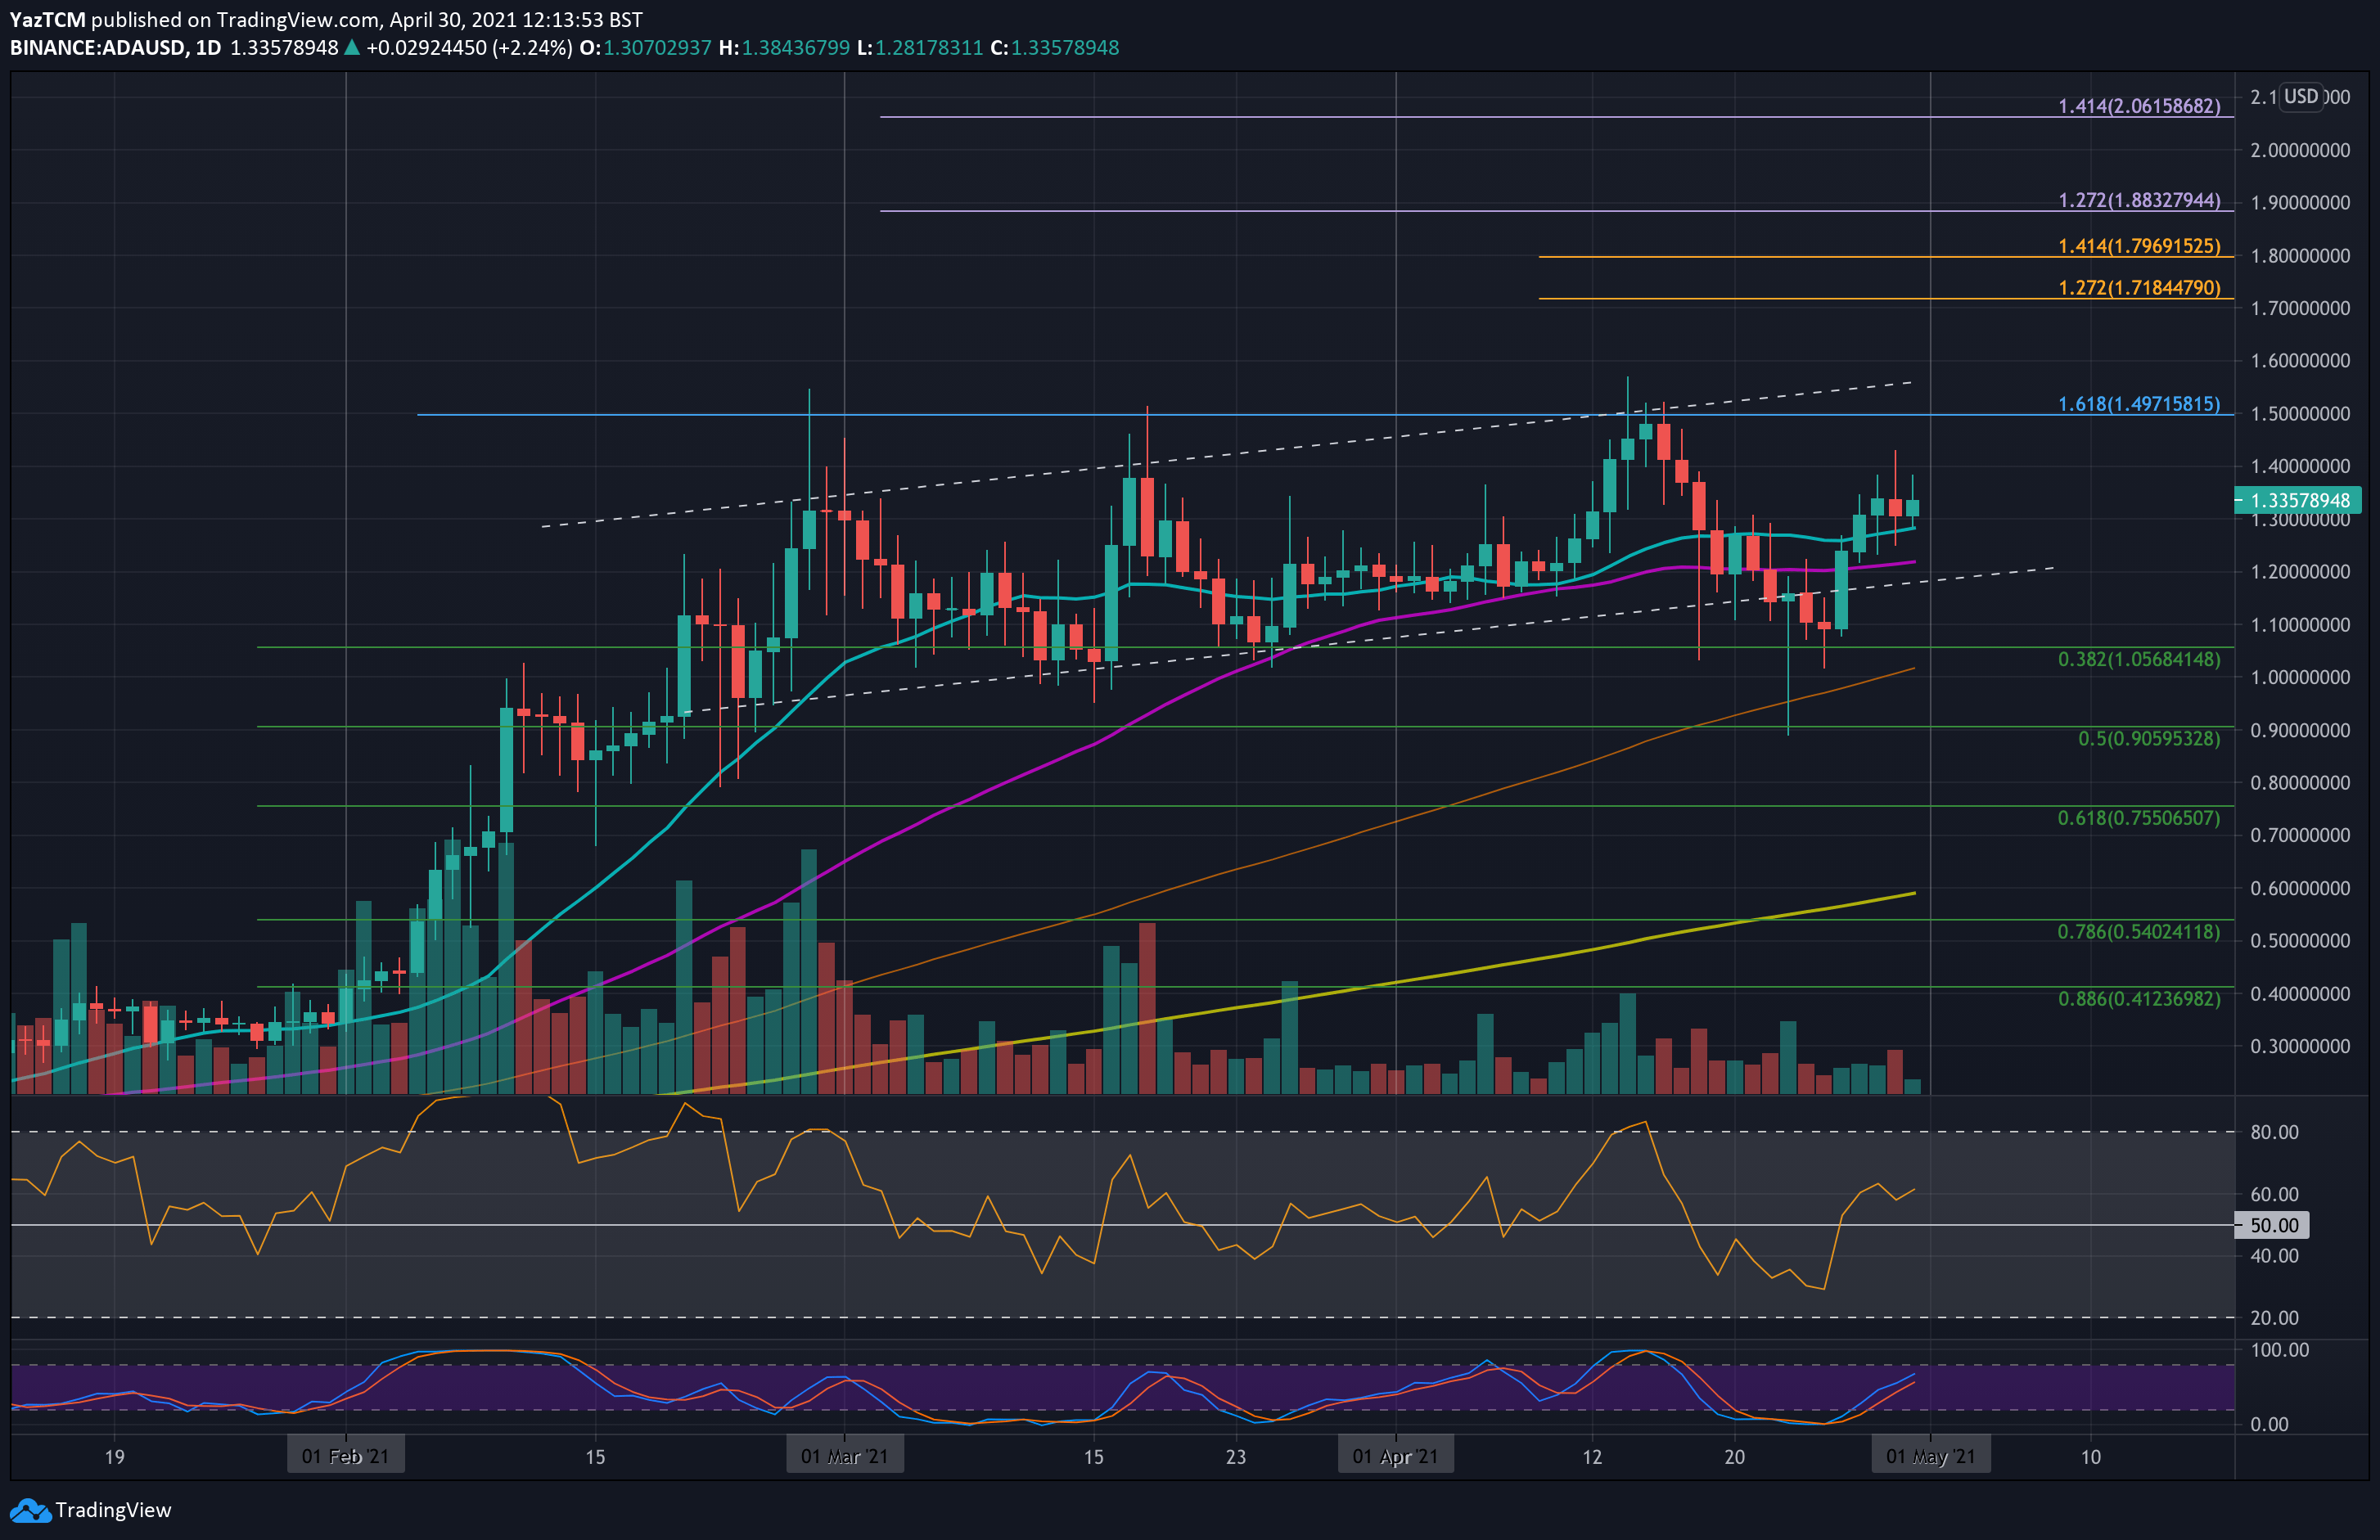
ADA is up by a respectable 17% this week as the coin hits $1.33. ADA found support around $1.10 at the start of the week as it began to push higher again. By Tuesday, ADA had climbed back above the 20-days MA after staying underneath it for eight days.
The coin seems to now be struggling to make any ground above $1.35 and must break this level to be able to continue a recovery back to the April highs.
Looking ahead, the first level of resistance lies at $1.35. This is followed by $1.50 (1.618 Fib Extension), $1.58 (ATH price), $1.72 (1.272 Fib Extension), and $1.80 (1.414 Fib Extension).
On the other side, the first support lies at $1.30 (20-days MA). This is followed by $1.20 (50-days MA), $1.10, and $1.00 (100-days MA).
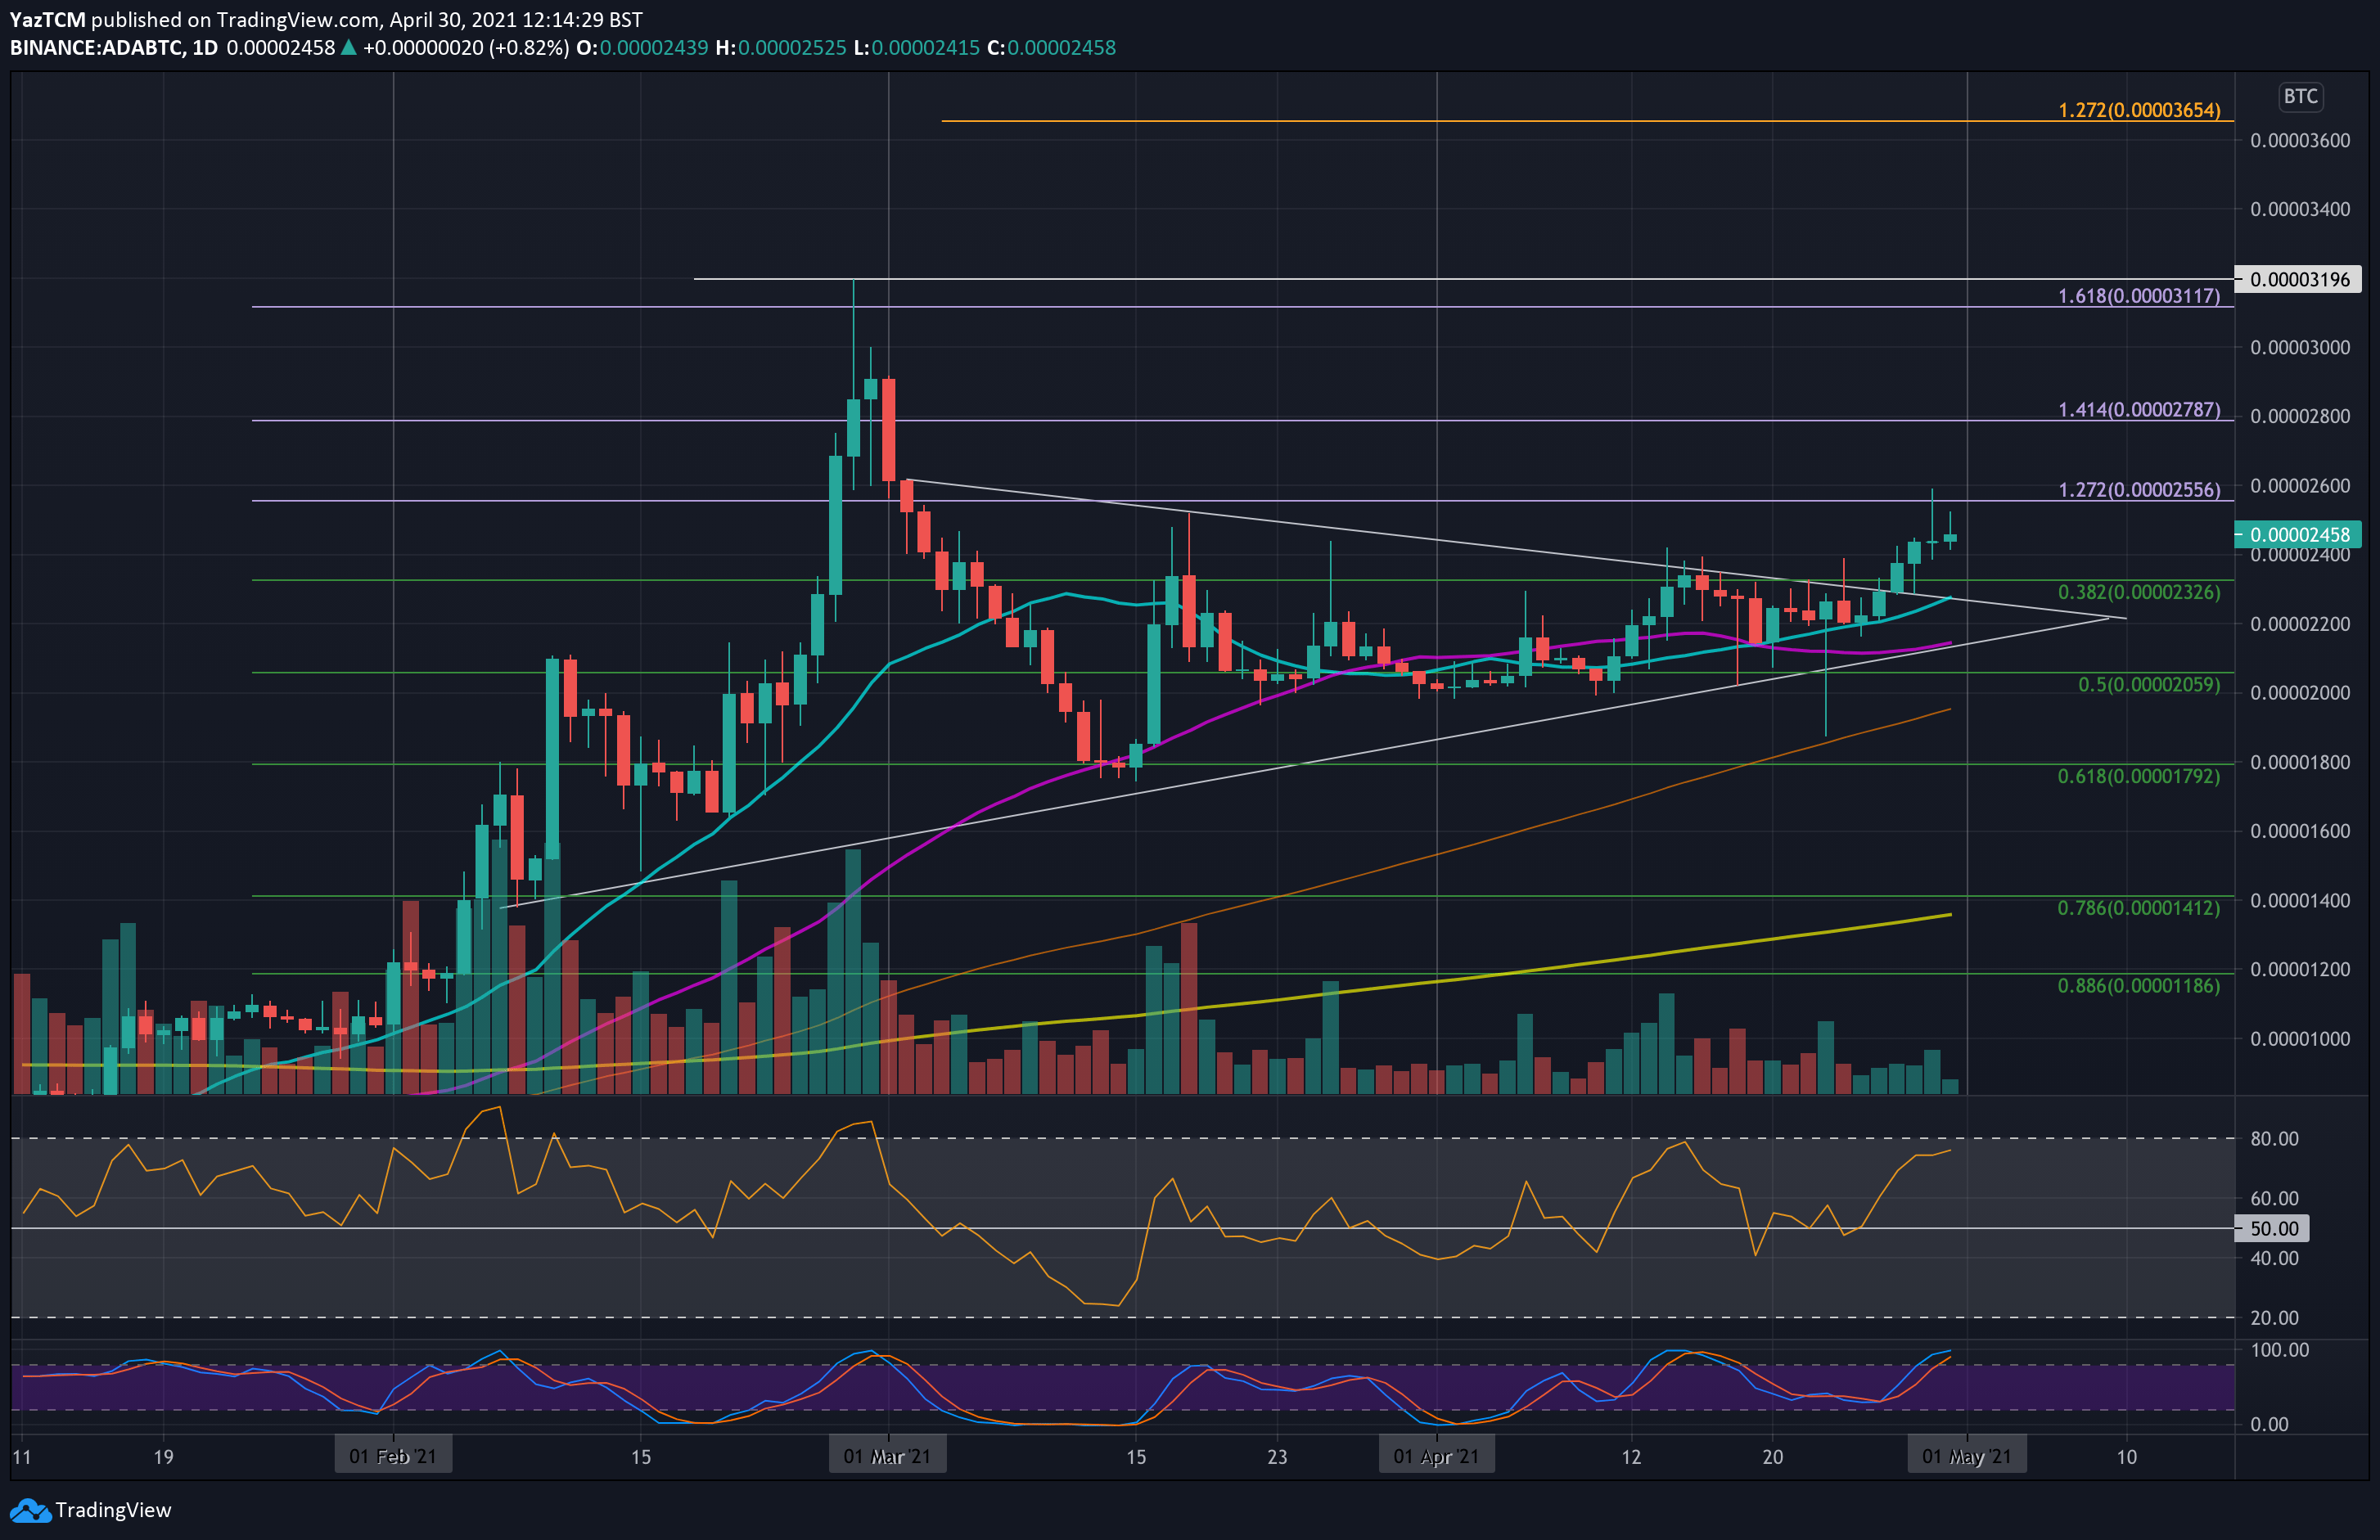
ADA is also performing very well against bitcoin this week. The cryptocurrency had been trading inside a symmetrical triangle pattern for the past two months of trading. At the start of this week, ADA found support at 2200 SAT (20-days MA) and started to push higher.
It managed to break out of the symmetrical triangle pattern on Tuesday, and it continued to set a new high for April yesterday at 2600 SAT.
Moving forward, the first resistance lies at 2600 SAT. This is followed by 2800 SAT (1.414 Fib Extension), 3000 SAT, and 3196 SAT (Feb highs).
On the other side, the first support lies at 2400 SAT. This is followed by 2300 SAT (20-days MA), 2200 SAT, and 2060 SAT (.5 Fib).
Binance Coin
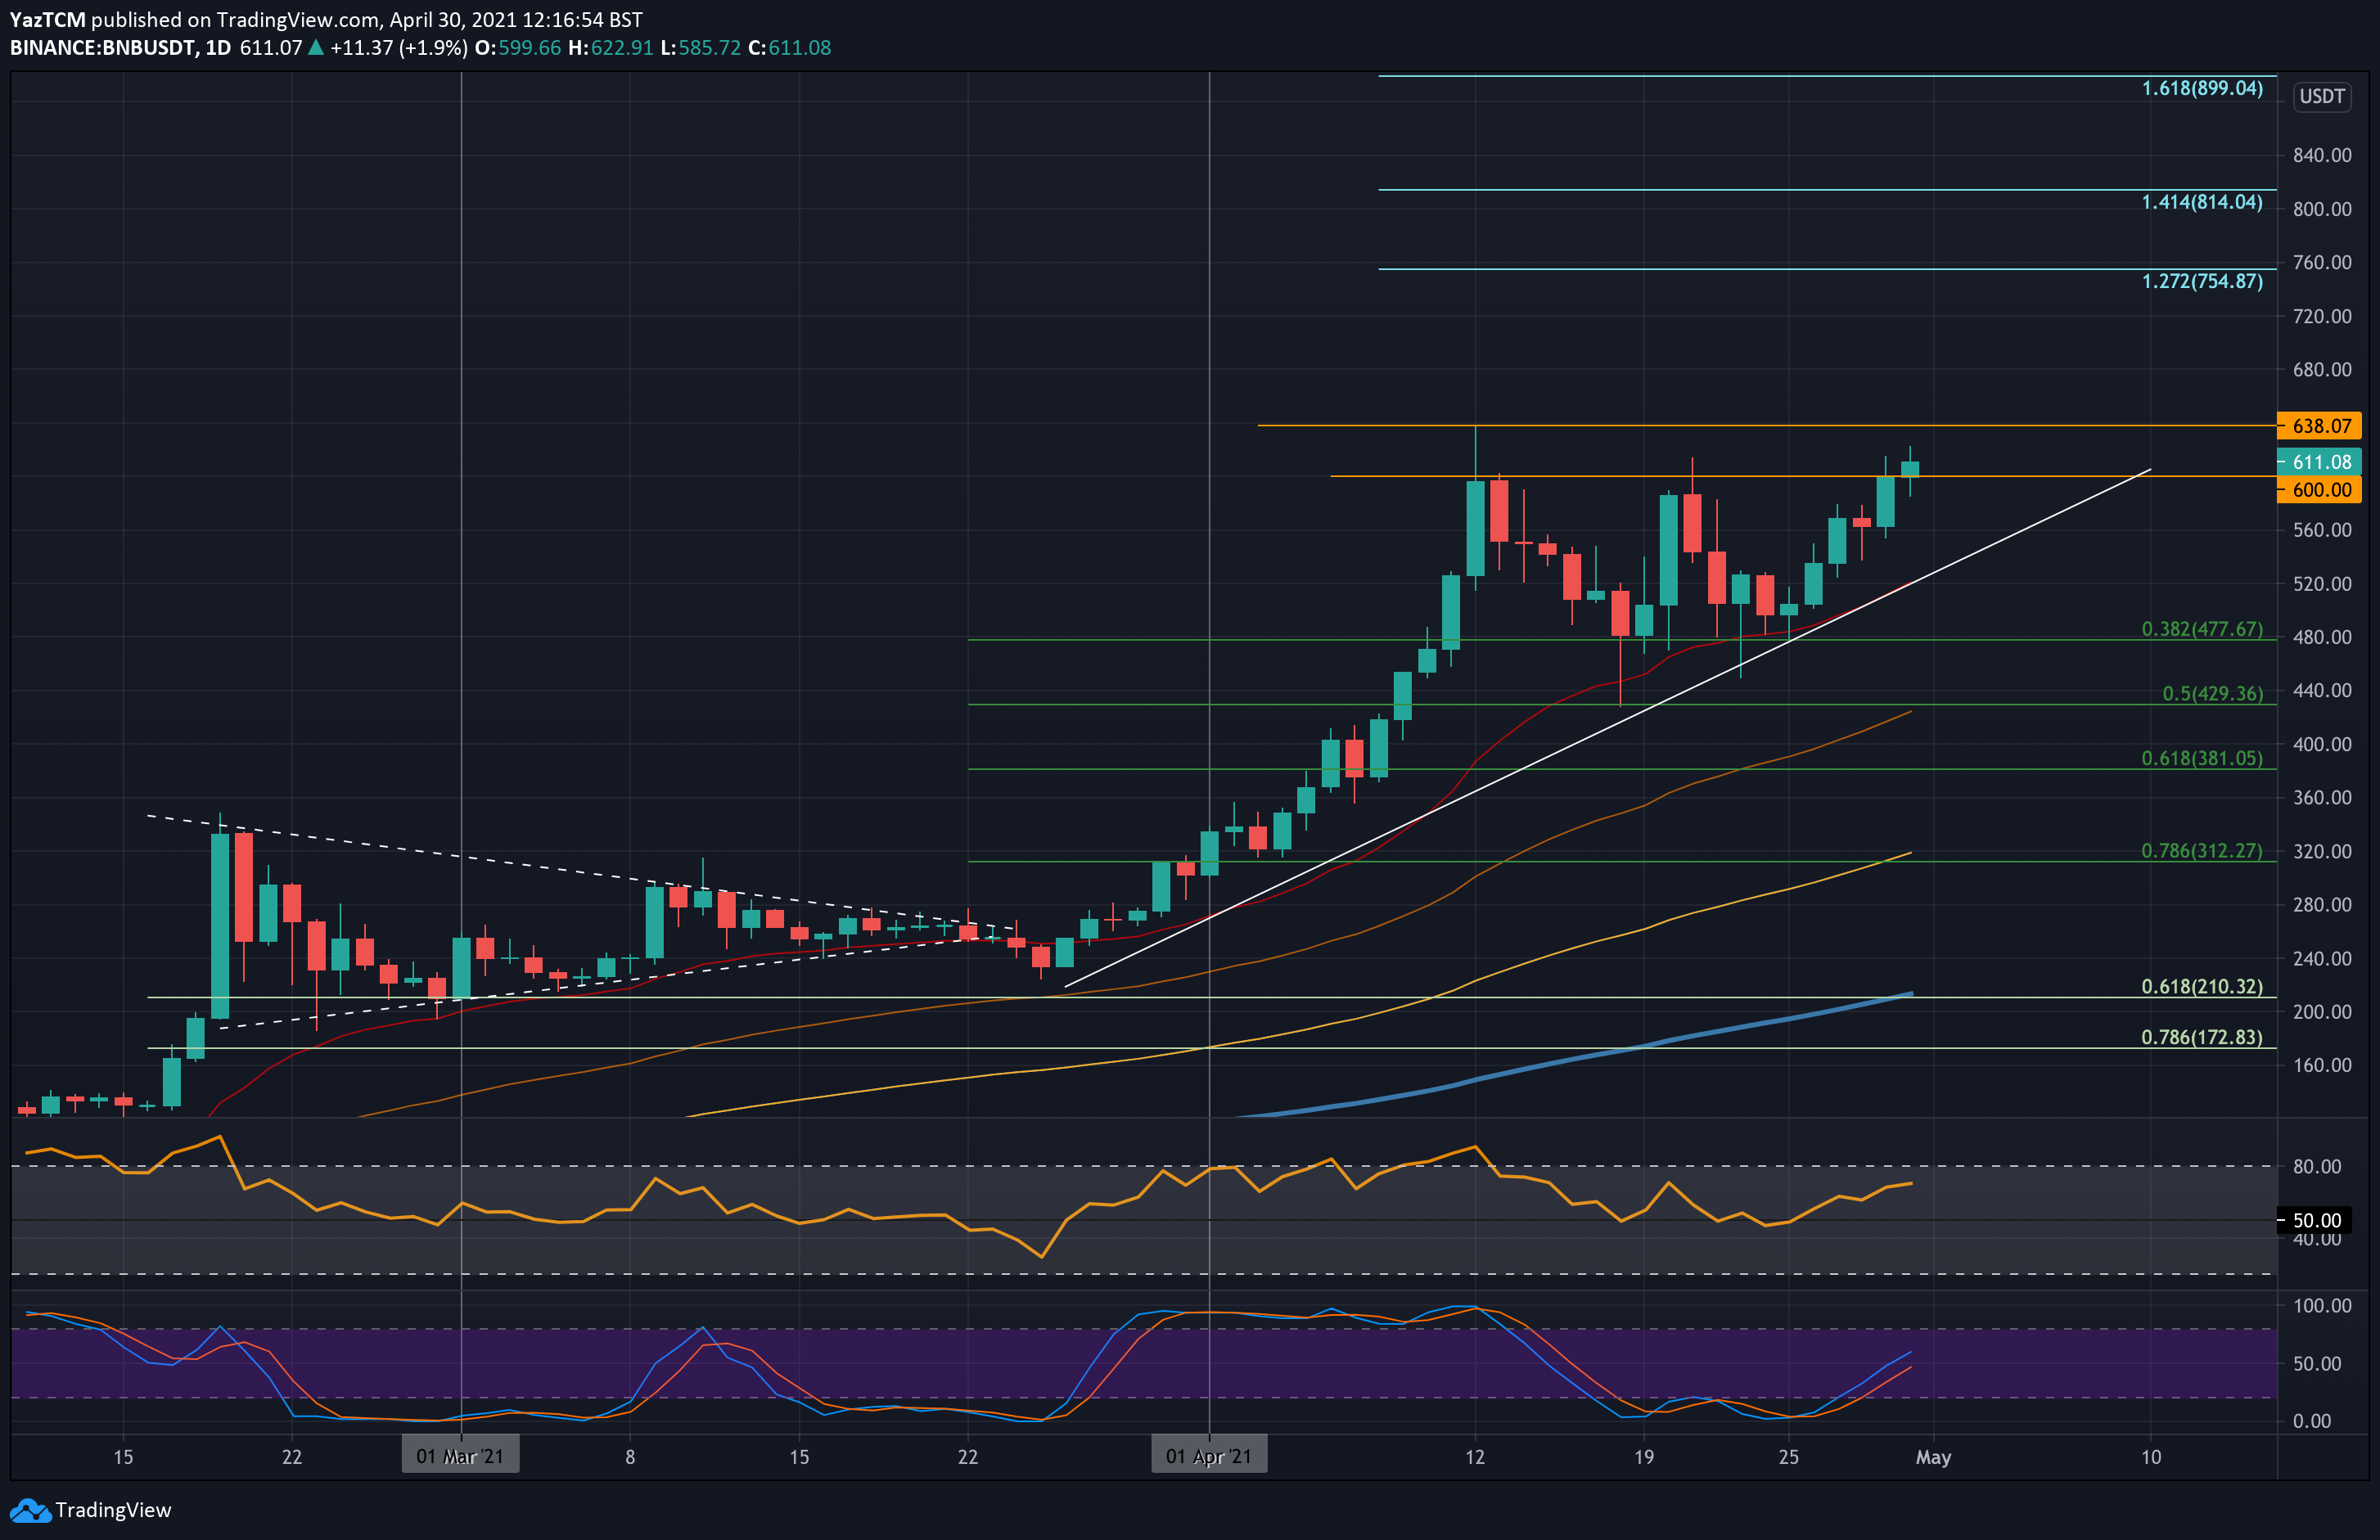
BNB saw a strong 18.7% price surge this week as the cryptocurrency climbs above $600 and heads back toward the ATHs at $638. BNB has been trading inside an ascending price triangle for the past month, with the roof of the triangle at $600.
The coin found support at $477 (.382 Fib) at the start of the week as it started to push higher again. It reached the roof of the triangle yesterday and managed to penetrate above it today as it breaks above $600.
Looking ahead, the first resistance lies at the ATH price of $638. This is followed by $680, $700, $720, $755 (1.272 Fib Extension), $800, and $815 (1.414 Fib Extension).
On the other side, the first support lies at $600. This is followed by $560, $520 (lower angle of triangle), $500, $477 (.382 Fib), and $430 (.5 Fib).
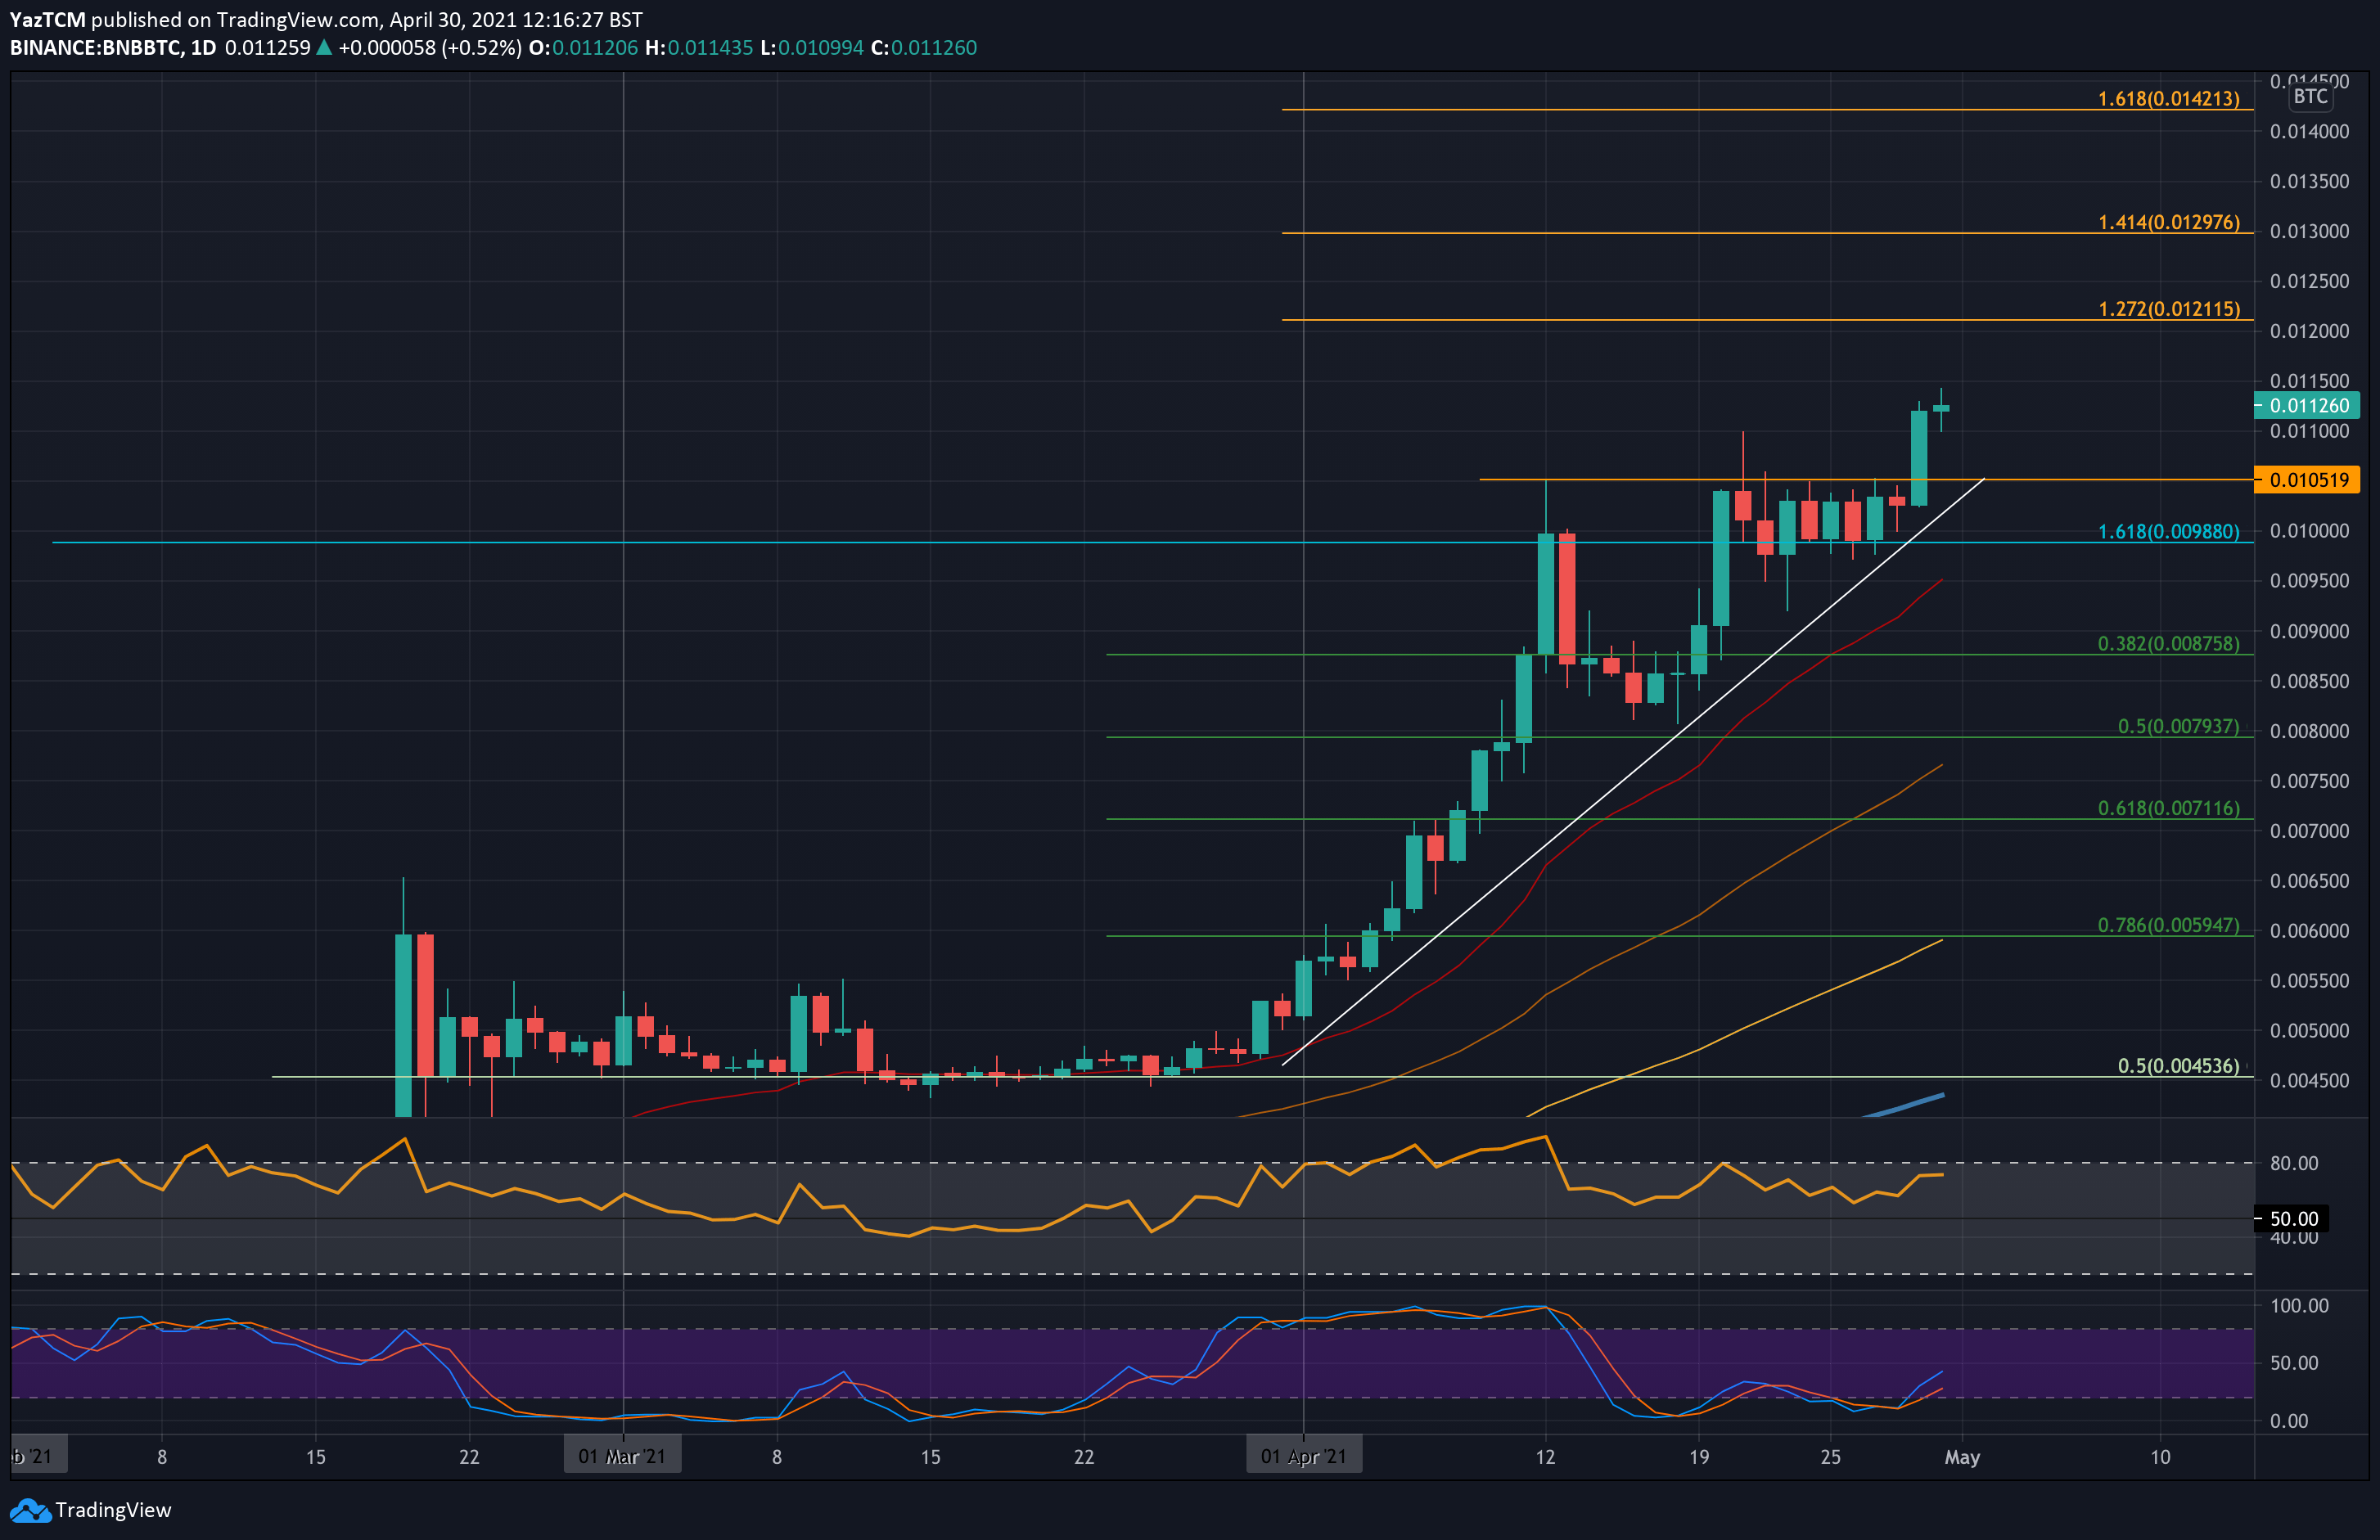
BNB is also performing very well against bitcoin this week as it sets a new ATH price at 0.0114 BTC. The market was also trading inside an ascending triangle throughout the past fortnight with the roof at 0.0105 BTC.
Additionally, BNB was trading inside a tight range between 0.0105 BTC and 0.00988 BTC for the past ten days. This range was not penetrated until yesterday as BNB started to surge to set the new ATH price today.
Looking ahead, the first resistance lies at 0.0121 BTC (1.272 Fib Extension). This is followed by 0.0129 BTC (1.414 Fib Extension), 0.0135 BTC, and 0.0142 BTC (1.618 Fib Extension).
On the other side, the first support lies at 0.0105 BTC. This is followed by 0.01 BTC, 0.0095 BTC (20-days MA), 0.00875 BTC (.382 Fib), and 0.08 BTC.