- KSM is undergoing a downtrend after creating a new 52 weeks high of $566.74 and found a recent support level near 100 EMA and $313 level.
- Currently, the coin price is just above the 50 EMA with the recently forming evening star pattern, implying that the reversal is possible.
- The KSM/BTC pair is trading at 0.007124 with hardly any intraday move.
Source- tradingview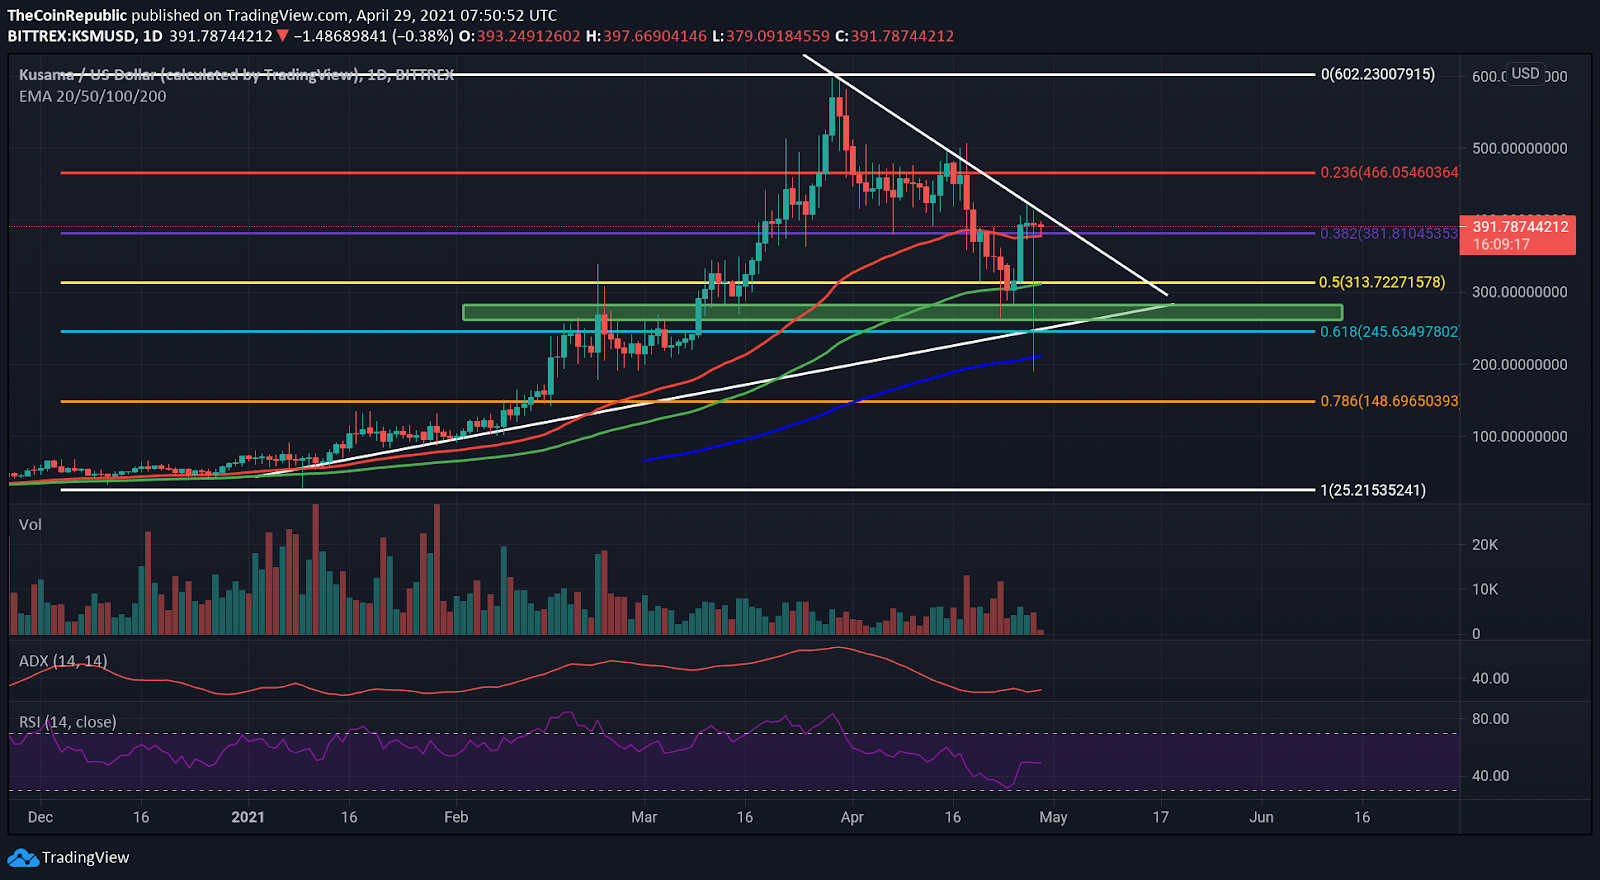
KSM coin price fell after creating a new 52-week high of $566.74 and is now rising again with the support from 100 EMA, just like many other coins; currently, it is holding just above 50 in the daily timeframe but the resistance trendline might reverse the trend again. The selling volume over the daily chart is more than the buying volume. 100 EMA support level was accompanied by a $313 level which is close to the 0.5 Fibonacci level and has helped push the price up. The live Kusama price today is $388.09 with a 24-hour trading volume of $189,464,481. The live market capitalization of the coin is $3,287,173,197
Resistance trendline Vs Support zone
Source – tradingview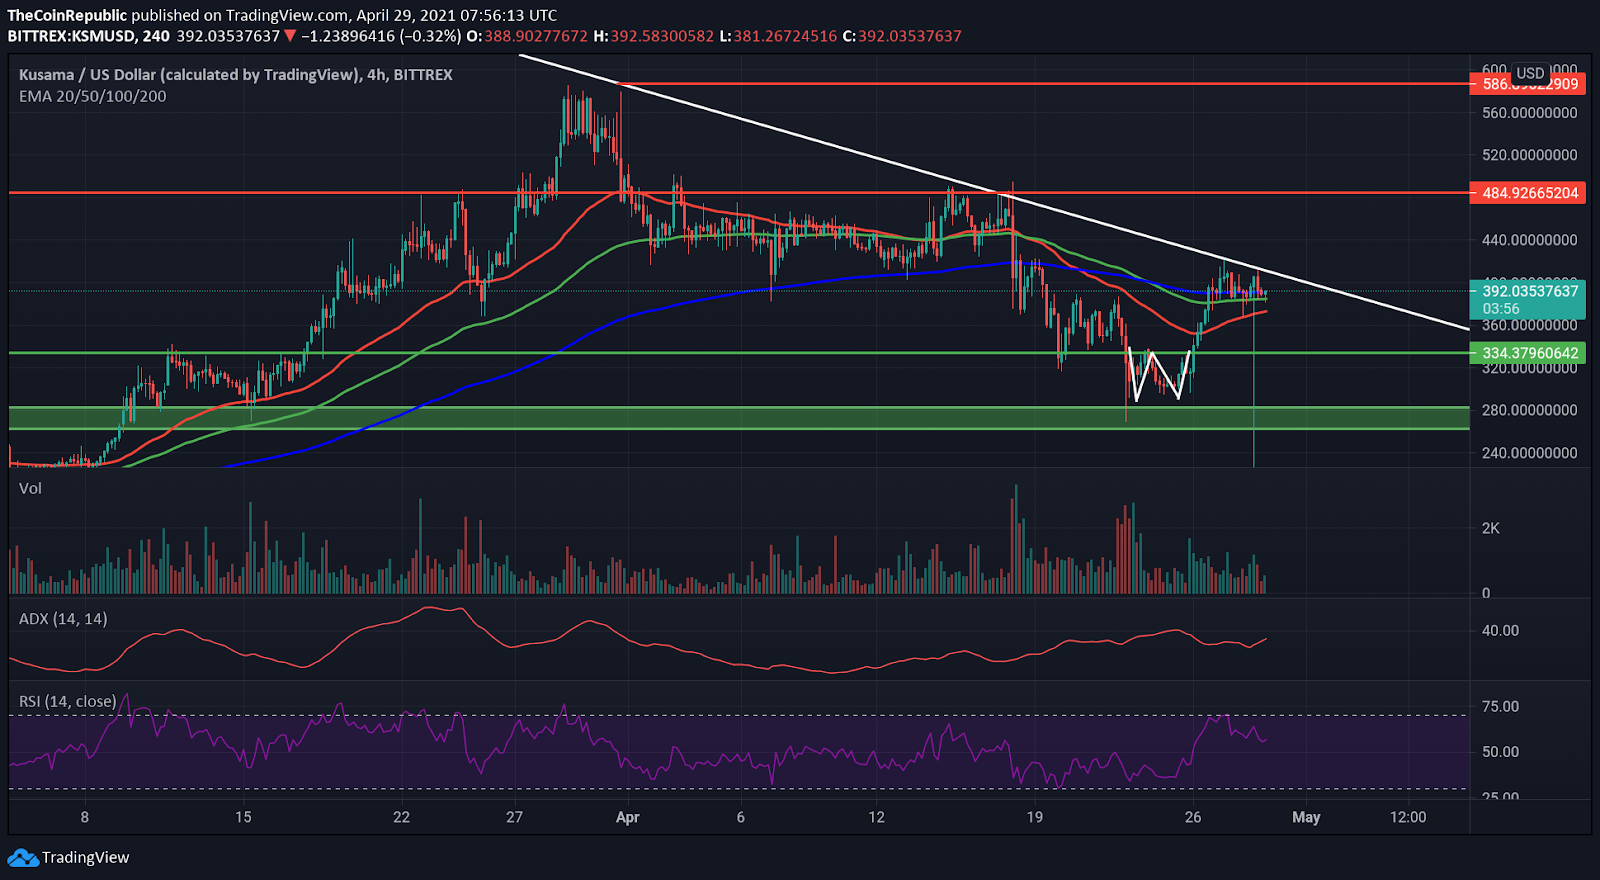
KSM had made a recent double bottom pattern in the 4-hour timeframe to boost the price by more than 25%. However, the coin price is facing resistance from the correction line which has pushed the price back down twice. A reversal will lead to another 25-30% fall. The coin price has been consolidating for the past 24 hours and has not given any noteworthy move on either side. The support zone between the level $260-$280 has pushed the price back up; however, it might not be able to hold the price for longer. The level of $334 is the immediate support, whereas the immediate resistance level is $484
The 25% price increment has resulted in price crossing over the 50 EMA(red) implying bullishness but the resistance trendline has managed to halt the trend for now and might even push it back down.
The RSI (slightly bearish) indicates slight bearishness while trading at 55 and slowly heading down the oversold zone.
The ADX indicates a slower momentum as it is trading at 35 and the slope in ADX is decreasing, implying a loss of momentum.
Conclusion – KSM coin price has recently exhibited a breakout of a double bottom pattern suggesting the start of an uptrend but the correction line is ready to push the price back down as soon as consolidation ends. Loss of momentum along with the bearishness showcased by RSI might slow the bulls down, hence, early traders should enter only after retest confirmation.
Support- $334 and zone of $260-$280
Resistance- $484
Vishal