Holo is a peer-to-peer platform used for hosting decentralized applications built using Holochain. Holochain is a framework for building DApps that does not require the use of blockchain. The goal is to bridge the gap between the internet and applications that are built on Holochain. Holo offers an ecosystem and marketplace in which DApps built using Holochain are easily accessible. The HOT technical analysis is as follows:
Past Performance
On April 21, 2021, HOT opened at $0.126 and on April 27, closed at $0.0.162. Thus, in the past week, the HOT price has surged by approximately 30%. In the last 24 hours, HOT has traded between $0.130-$0.164.
https://www.tradingview.com/x/ytRbVTH6/
Day-Ahead and Tomorrow
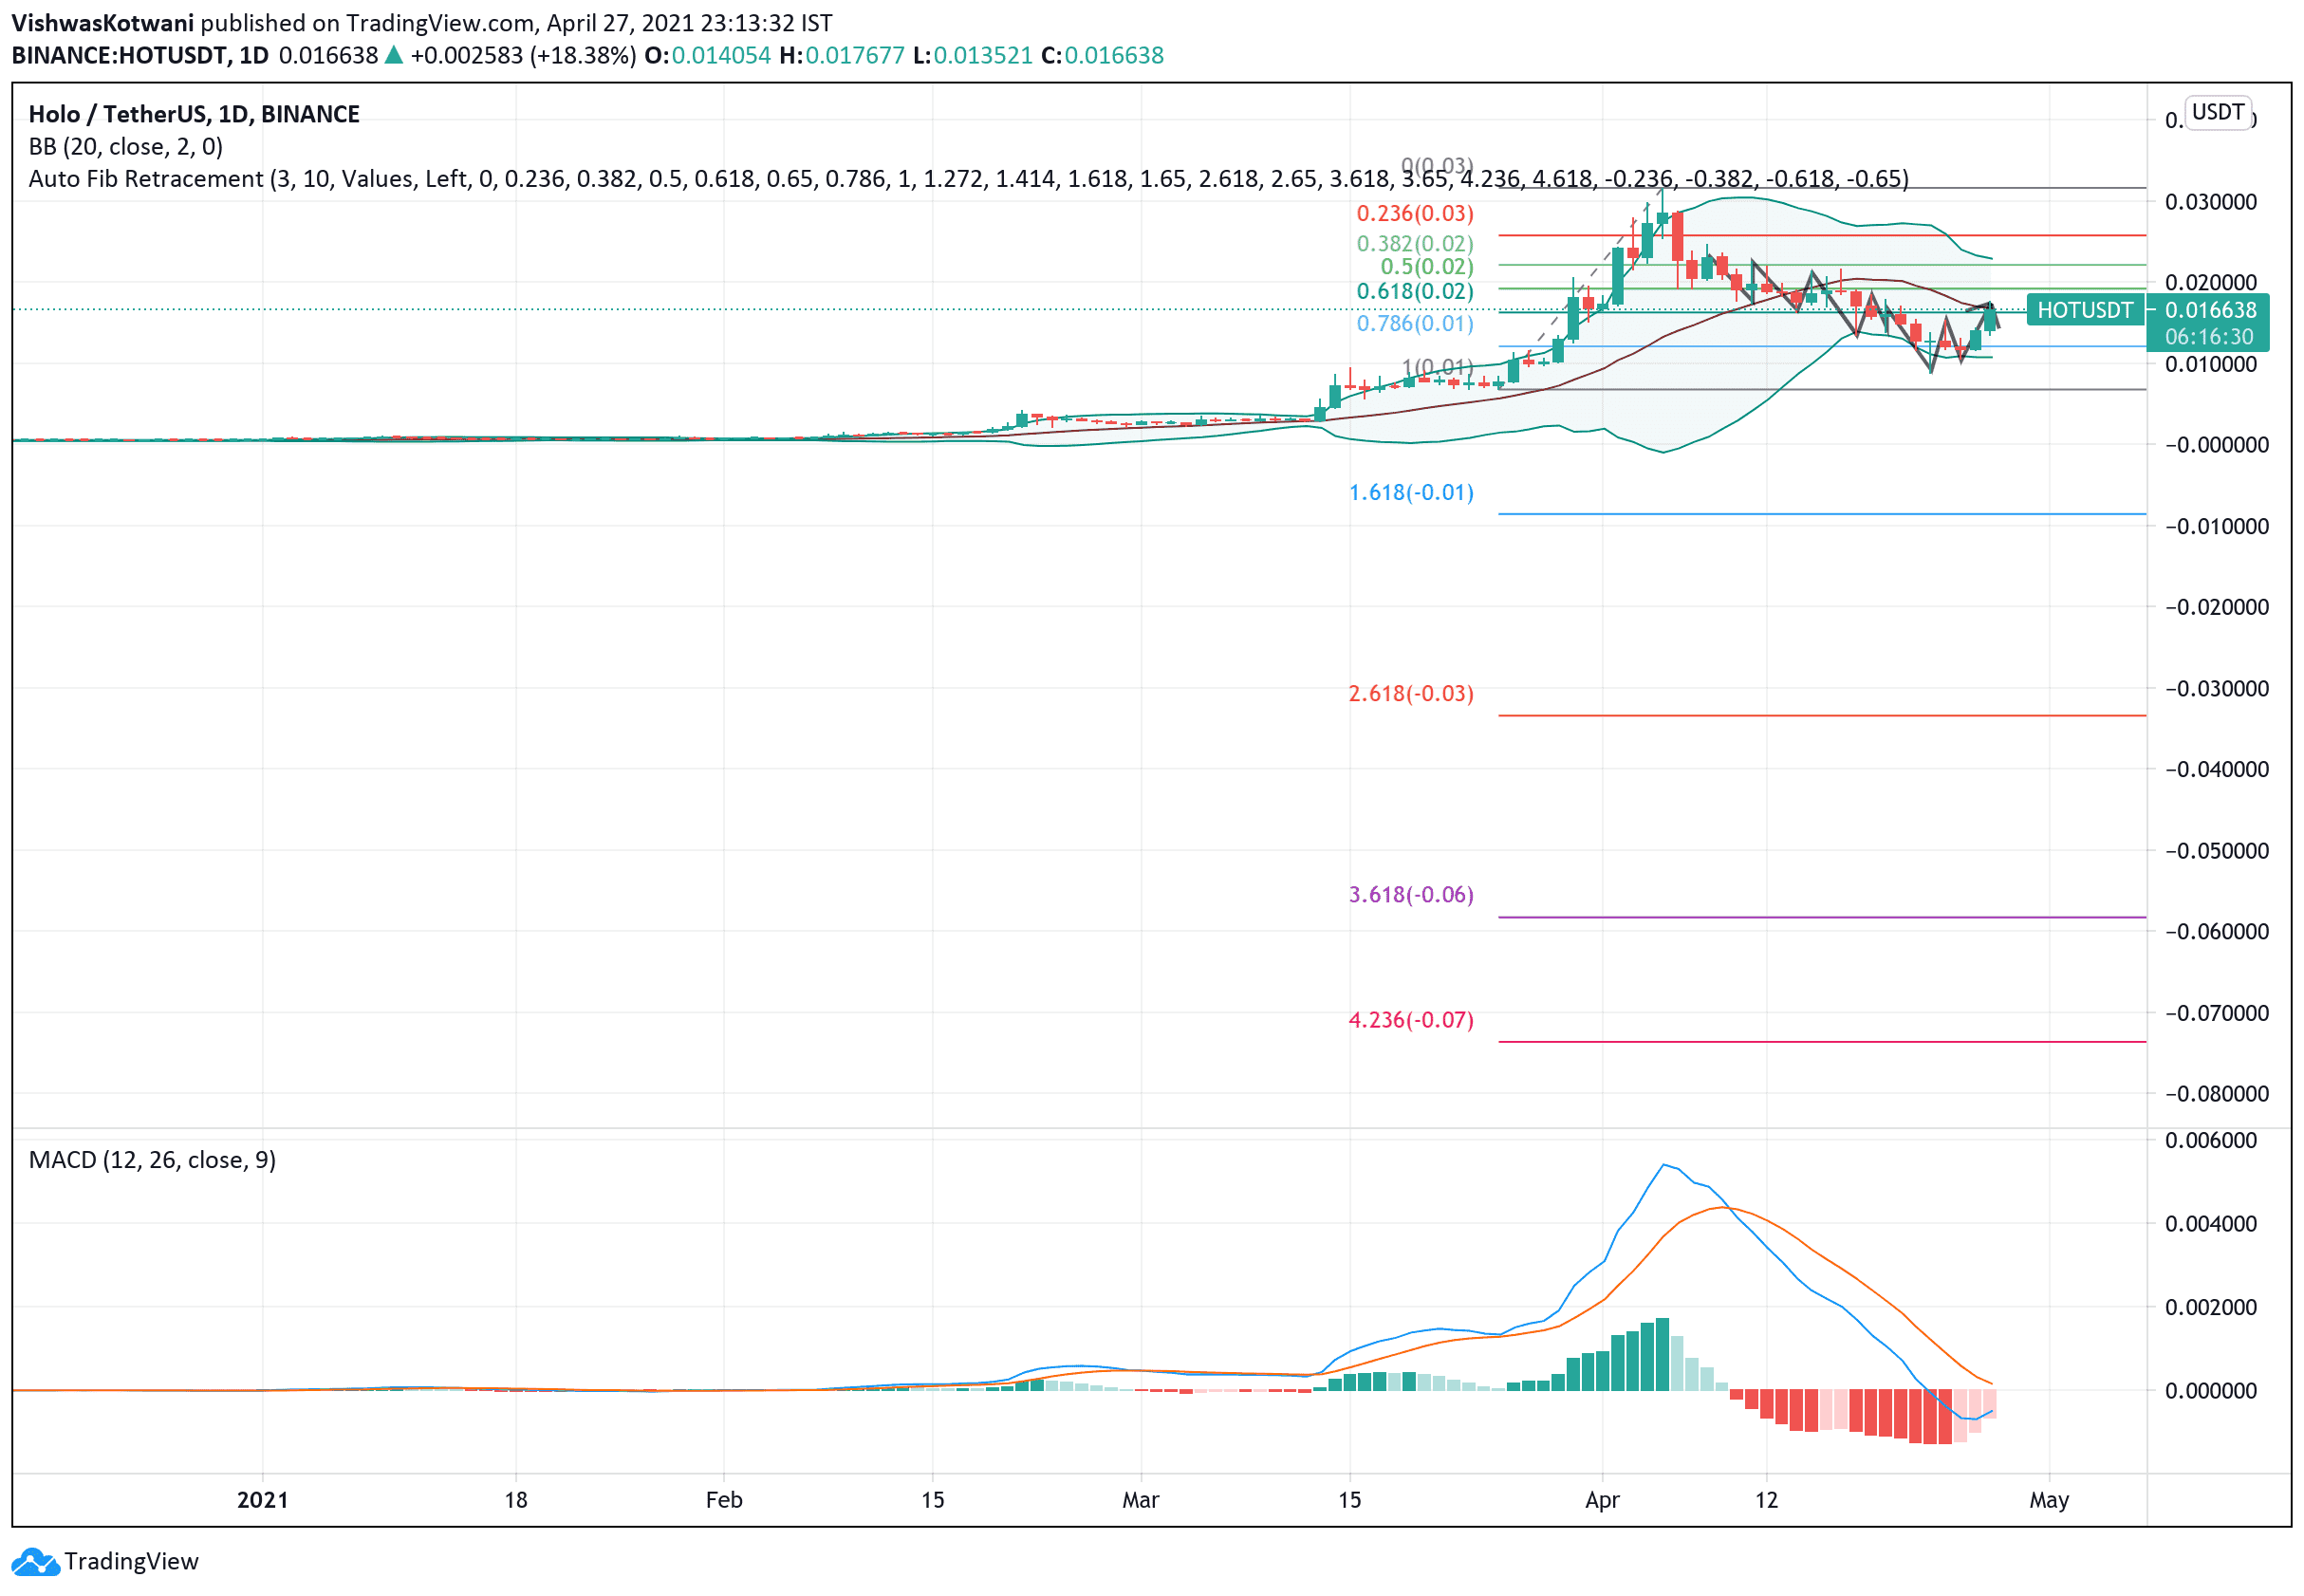
HOT is ranked #51 on the coin market cap and at the time of writing, it was trading at $0.016638.
The shift in price from last month indicates the rising volatility. Currently, the RSI indicator is at 50%. It faced rejection at 42% and rose to the current level. Thus, buying pressures are slowly building. Hence, the price may start rising after some time.
Currently, the price is below the first Fibonacci pivot support level of $0.204. It may soon fall below the subsequent support levels of $0.2 and $0.191, respectively. We can see the contraction coming between the upper and the lower band, thus suggesting stable volatility.
The MACD signal line crossing from above is giving a bearish outlook for this daily chart, and we can see a short pullback to the support level. Currently, $0.017684 is proving to be strong resistance.
HOT Technical Analysis
The important level to look at our technical analysis currently is $0.017684. It is acting as a strong resistance and stopping the price movement upside. If it breaks the resistance region of $0.019173, then in the next level it can touch is $0.022093 and then show us a bullish signal.
On the other hand, the 23.6% FIB retracement level from this level can pull the price to $0.01274, which is a strong support zone. This will give us a bearish trend, and we’ll have to wait for a bullish signal.