- THETA started to fall after the recent 52 weeks high of $15.9 and
- Currently, the coin is trading just below the 50 EMA, which is above the 100 & 200 EMA, implying the uptrend is intact.
- The THETA/BTC pair is trading at 0.00017777 with an intraday gain of 3.22%
 Source- tradingview
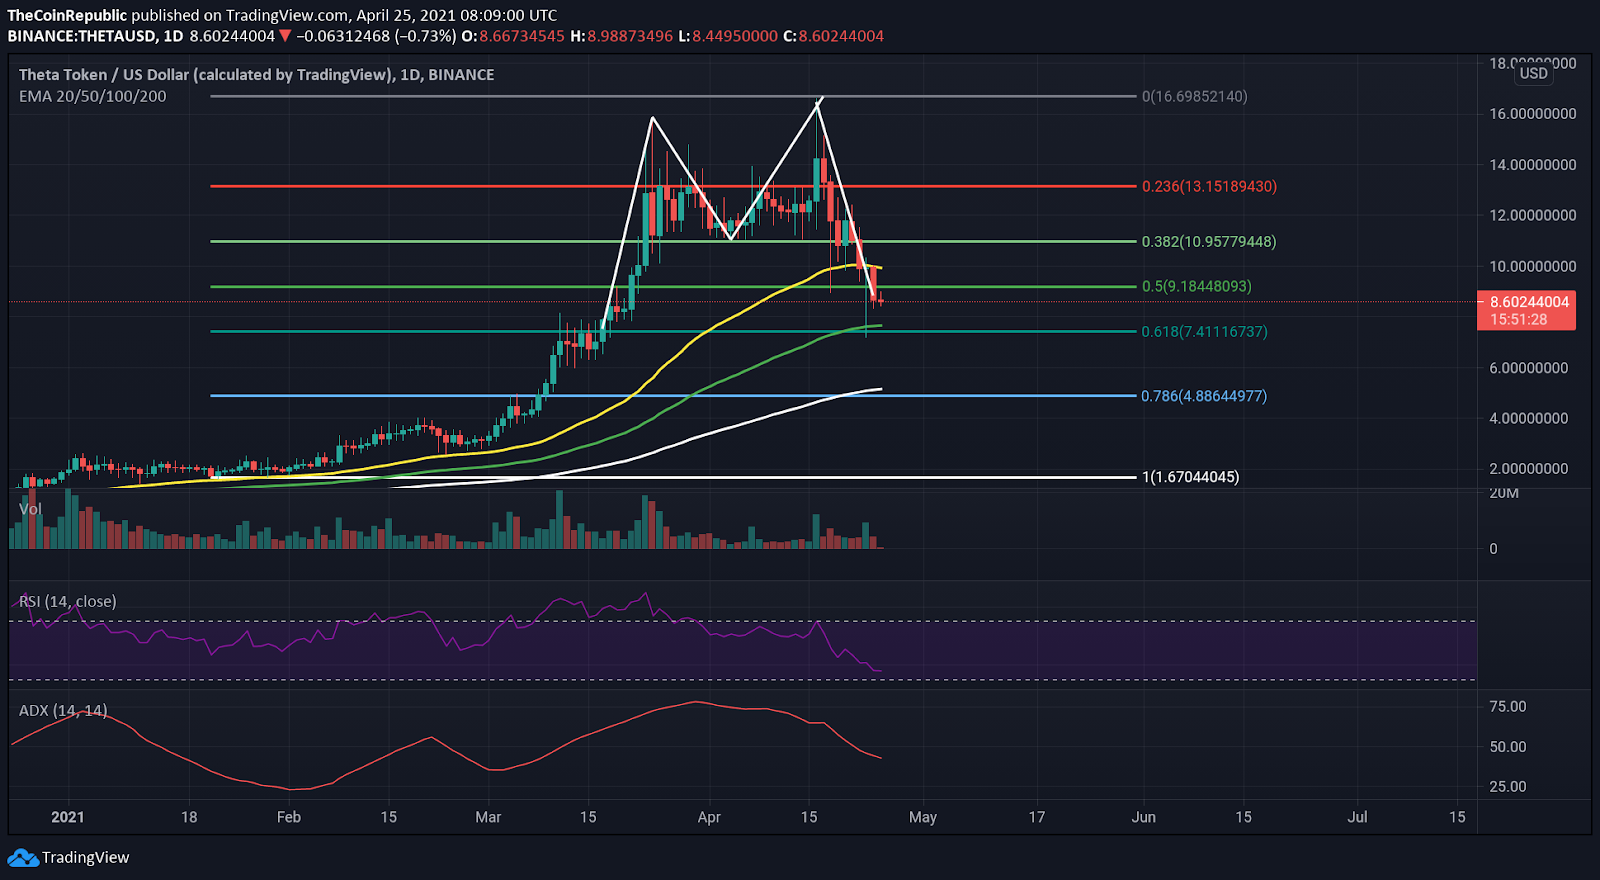
THETA coin price has been falling ever since, making the new 52-week high of $15.9; currently, it is holding above 100(green) and 200 (yellow) EMA in the daily timeframe. The volume is diminishing in the daily chart.
After a sharp selloff, a new support level was observed at $11, i.e., 0.382 Fibonacci level, and then it was breached till the next Fibonacci level of 0.5, which is at $9.1. A long-tail candle observed near 100 EMA might reinstate the uptrend.
The live THETA price today is $8.75 USD with a 24-hour trading volume of $246,913,266. THETA is down 7.34% in the last 24 hours. The live market capitalization of the coin is $8,748,994,555.
Failure Of 200 EMA may lead to the downfall
Source – tradingview
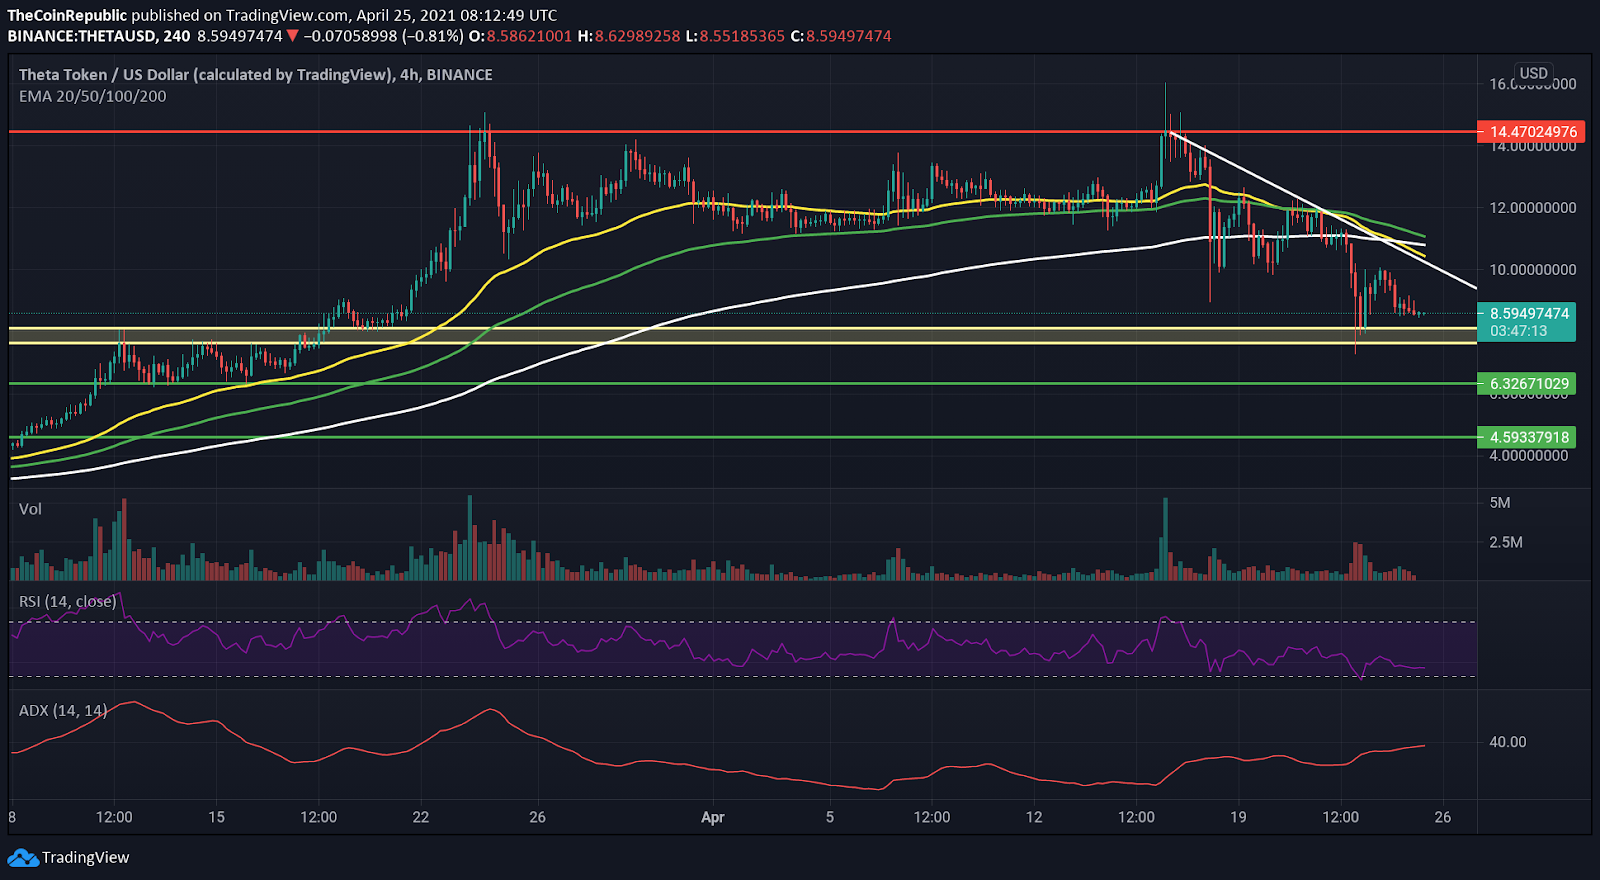
THETA coin has made a descending triangle pattern in the 4-hour timeframe after reversal from a 52-week high level. THETA coin price has been resonating in the pattern for days now. A short-term pullback is expected to give a retest for the fallout. The coin price has fallen 7.34% in the last 24 hours. The support zone between $7.6-$8.1 has pushed the price back up; however, the resistance trendline observed has managed to push down the price. The levels of $6.3 and $4.5 are the immediate support, whereas the immediate resistance level is $14.47.
The coin price is below the major 200 EMA (white), 100EMA (green), and 50 EMA (yellow). The 50 EMA has recently given a golden bearish crossover with 200 EMA in the 4-hour timeframe, implying the price fall.
The RSI (Bullish) indicates bullish momentum while trading at 39.43. THETA, after a slope down, is now driving higher towards the overbought zone.
The ADX indicates a gaining momentum as it is trading at 36 while the spike in ADX is increasing, implying a positive growth in momentum.
Conclusion – THETA coin price has recently formed a descending triangle pattern in the 4-hour timeframe along with the double bottom in the daily timeframe, suggesting the start of another downtrend. A short-term pullback is anticipated to give a retest of the fallout. Support from the zone between $7.6-$8.1 and long tails near the support zone could push back up, resulting in a breakout, so early traders must wait for retest confirmation.
Support– $7.6-$8.1
Resistance- $14.47