TL;DR Breakdown
- Cardano price analysis shows price losing further ground on $1.10 resistance level
- ADA fell 7 percent over the past 24 hours to move below previous support at $0.90
- Buyers expected to swoop in before next key support at $0.79 is approached
Cardano price analysis continues to stay bearish, with price dropping as low as $0.83 over the past 24 hours. ADA remains below the 9 and 21-day moving averages and a breakdown around the previous support level of $0.82 would put the token in a deeper correction that could take price as low as $0.5. Resistance at the current trend sits at $0.90 and a potential pullback before $0.80 would see that level regained along with the 9-day moving average. Over the past 24 hours, ADA trading volume grew more than 118 percent, signalling potential incoming buyer interest.
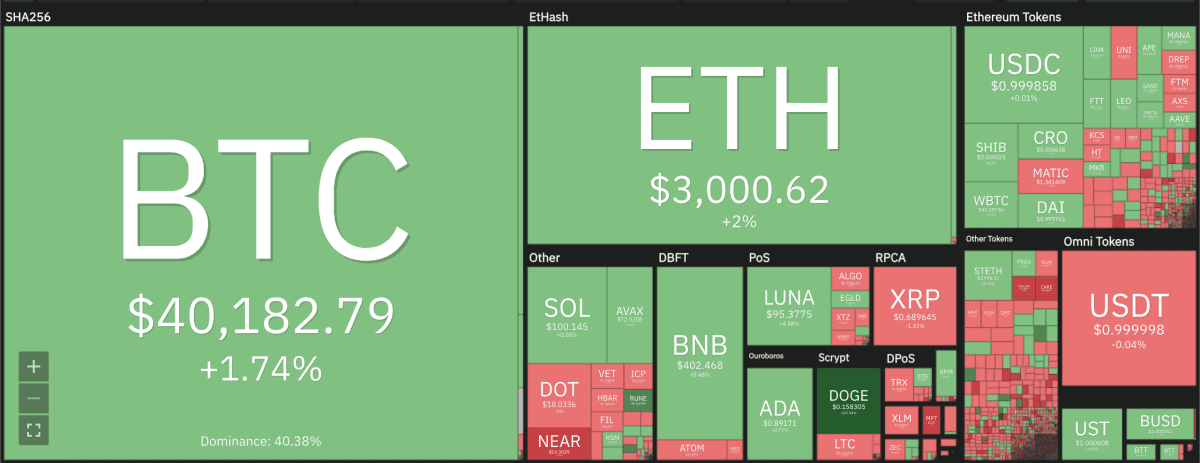
The larger cryptocurrency market posed a revival during the day’s trade, led by Bitcoin’s rise above $40,000 for the first time in a week. Ethereum also moved up to $3,000 with a 2 percent uptrend. Among Altcoins, Ripple declined down to $0.78, while Solana grew slightly to move above $100. Terra soared more than 4 percent to move up to $95.37, while Dogecoin posed the greatest increment with a 20 percent rise to move up to $0.16.
Cardano price analysis: Technical indicators show price set to remain sideways
On the 24-hour candlestick chart for Cardano price analysis, price can be seen forming a descending triangle pattern that initiated on April 20. Since then, ADA has lost 15 percent in price and it could yet continue to move sideways towards the lower boundary of the support channel at $0.79. The 50-day exponential moving average (EMA) sits at $0.91 which would be a profit taking target for the incoming buyers at current trend. The 24-hour relative strength index (RSI) continues to approach the oversold region in the late 30s. The RSI also formed a lower low and lower high over the past 24 hours, indicating a bearish trend.
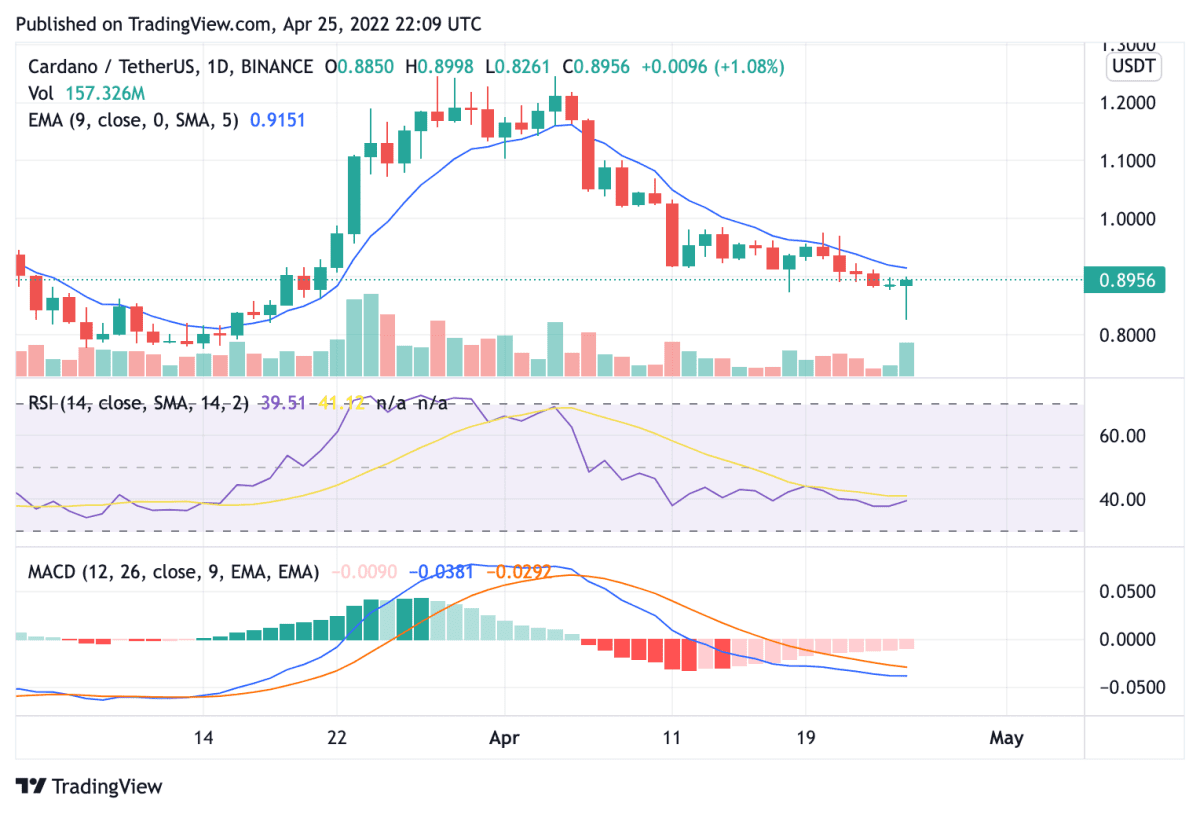
The Moving Average Convergence Divergence (MACD) also remains bearish as its moving averages expand as they fall. It shows that selling momentum is increasing in accordance with the trading volume. Conversely, the upside momentum will have to come in before price recedes to key support at $0.79 and push back up above the demand zone at $0.91. The next upside resistance level sits at $1.10 at current trend.
Disclaimer. The information provided is not trading advice. Cryptopolitan.com holds no liability for any investments made based on the information provided on this page. We strongly recommend independent research and/or consultation with a qualified professional before making any investment decisions.