As the buyer's line-up, the DOGE coin price surpasses crucial EMAs and prepares a jump to reach the $0.20 mark by crossing the 200-day EMA. Key technical points:
- DOGE prices crack below the $0.22 mark.
- The death cross gains a bearish spread.
- The 24-hour trading volume of Dogecoin is $3.08 Billion, marking a 600% rise.
Past Performance of DOGE
On the 24th of April, it was reported that the DOGE price hit daily candlesticks closing just below $0.133 support, suggesting that sellers could pull the coin below the bottom of March at $0.111. But, the current chart has a complete rotation as the Dogecoin price increases by 5% and climbs over the crucial support level. 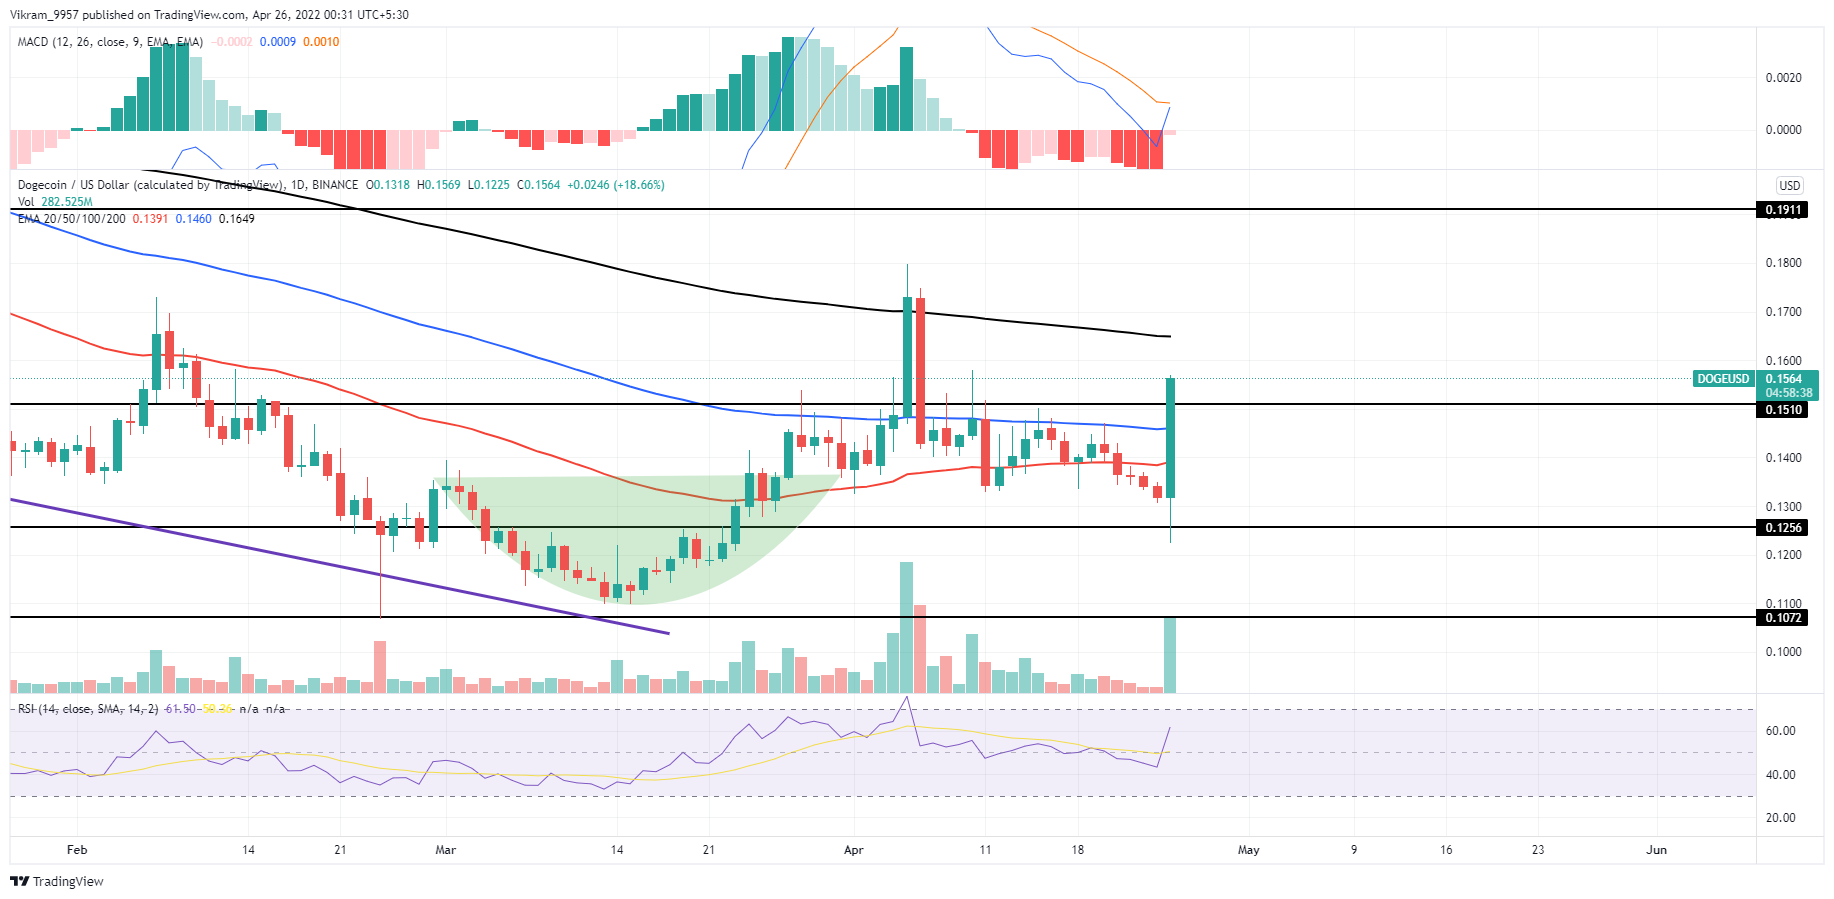 Source-Tradingview
DOGE Technical Analysis
On Sunday, the price of doge exceeded its $0.133 support, suggesting that sellers might extend the correction. However, the coin saw an impressive inflow on Monday and caused a 5% increase in price. The bullish offshoot in the Dogecoin market price surpasses the 50 and 100-day EMA to approach the 200-day EMA. Hence, the breakout of two crucial EMAs reflects a boom in buying pressure. MACD Indicator: a sharp upturn in the fast line nearing a bullish crossover indicates aggressive buying from traders. This crossover would bolster traders to a $0.18 breakout to reach the psychological mark of $0.20. RSI Indicator: The RSI values spike higher into the nearly overbought territory after outperforming the 14-day average line. Hence, the indicator reflects a phenomenal rise in the underlying bullishness. In a nutshell, the DOGE technical analysis shows a potential uptrend continuation to the 200-day EMA.
Upcoming Trend
A spike of 600% in trading volume indicates that the DOGE price may signal an upward breakout from the descending trendline. If buyers can succeed then the cryptocurrency would go 23.8%, before hitting resistance at $0.20 resistance. Resistance Levels: $0.18 and $0.20 Support Levels: $0.135 and $0.12