- XRP price after a profit taking or selloff form new 52-week high of $1.96, is now again ready to take off towards the mark of $2.00
- The XRP is in strong uptrend, however a retracement from higher is observed which is also healthier for next bullish momentum
- The pair of XRP/BTC is trading above all major and important moving averages, standing at 0.00002653 BTC with intraday loss of -1.95%
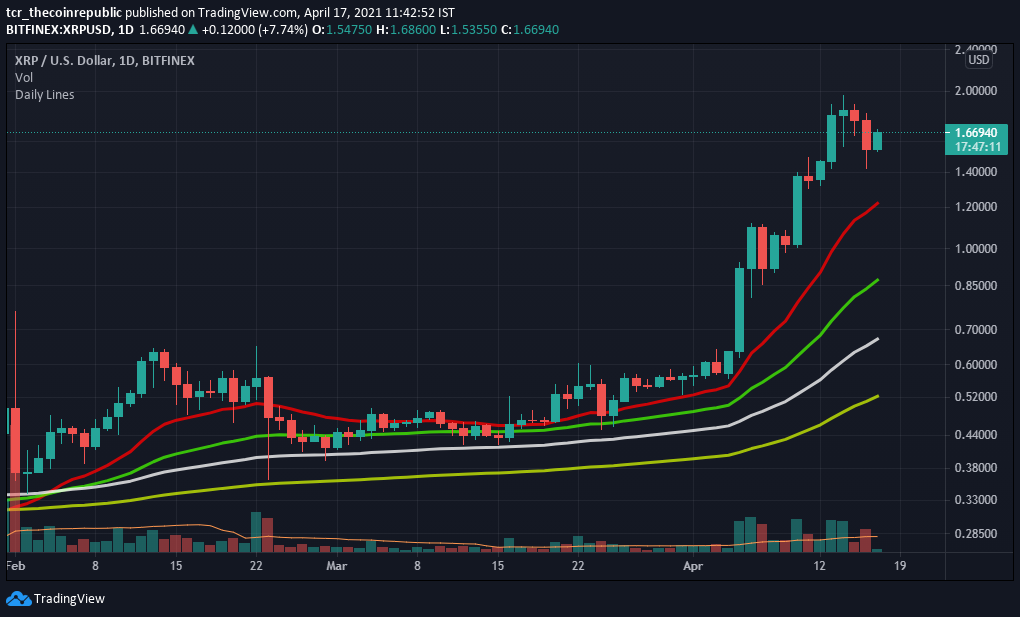
XRP price showed some sign of recovery after a sharp sell off from higher levels, as the coin slipped after the creation of a new 52-week high of $1.96. However, the overall trend is still in favour of bulls and the coin is also placed above major moving averages of 20,50,100 and 200-Day. similarly now XRP is indicating a sign of recovery which can pull it to the higher levels of $2.20 and 2.70 in upcoming trading sessions. Support on lower levels is placed at $1.40 and $0.96, likewise resistance on the higher side is situated at $2.00 and 2.50.
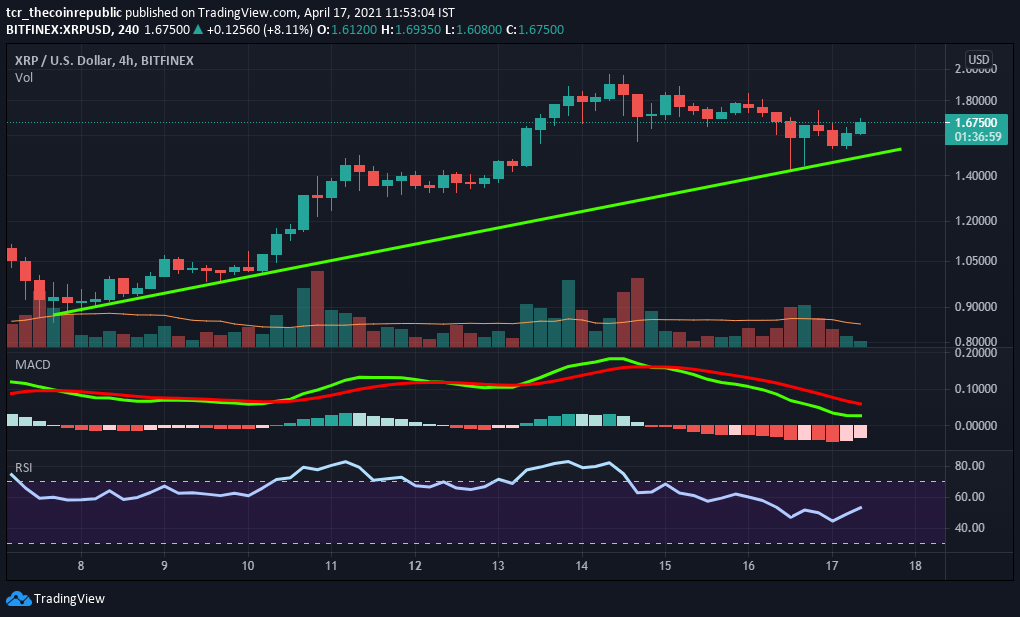
XRP price over the 4-hour time frame showcasing an upcoming bullish momentum, as the coin after taking support from the rising support line bounced well. Moreover, the indicators are now in favour of bulls and a smart recovery is expected from current levels. Support over the daily chart is placed at $1.40 and $1.10, meanwhile resistance on the higher side is situated at $1.85 and $1.98. Currently XRP is trading at the price level of $1.68 with intraday correction of -1.17% and with the volume increment of +44.00% standing at $21,303,516,824. With the total market capitalization stands at 4th rank while an intraday loss of -0.94% standing at $76,201,044,585.
Relative Strength Index (BULLISH) indicates bullish momentum while trading at 52.62. However, currently it is heading towards the overbought zone after recovering from lower levels.
Moving Average Convergence Divergence (BULLISH) currently indicates a bullish trend on the daily chart, as the buyer line (green) is now heading for a positive crossover towards the bear line (red).
Support levels: $1.40 and $0.96
Resistance levels: $2.00 and 2.50