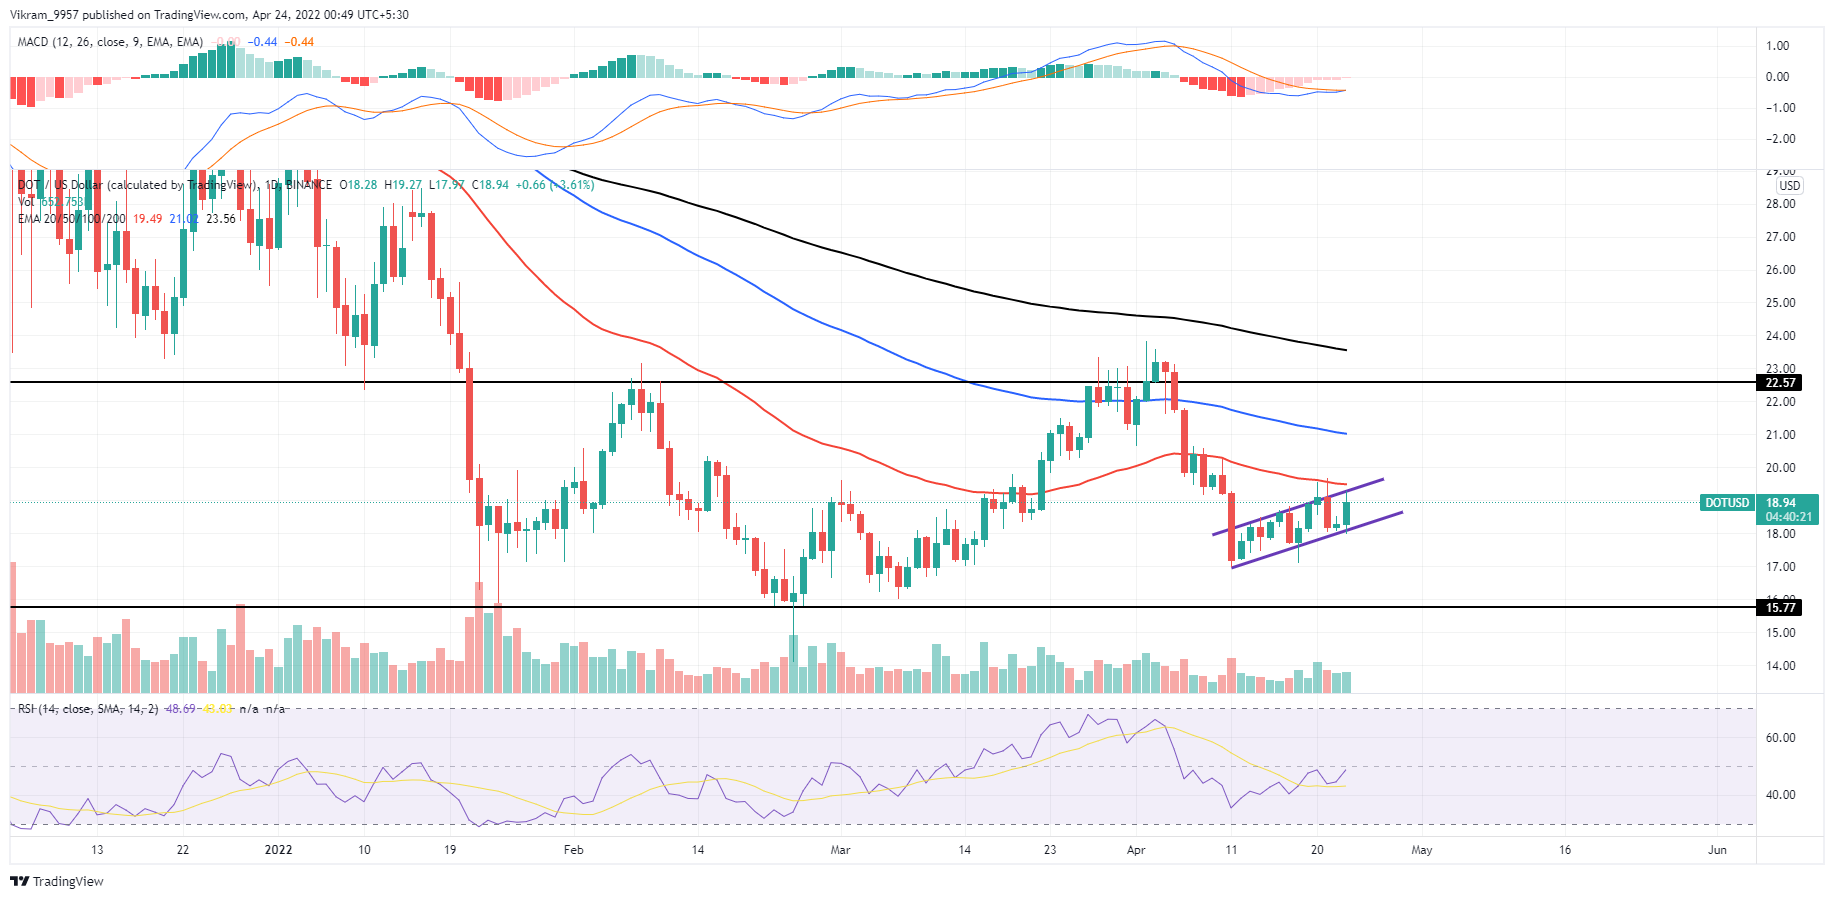
DOT coin price shows a recovery rally in a rising channel fashion representing a surge in the underlying bullishness. Will the uptrend surpass the $20 mark? Key technical points:
- DOT prices prepare a rising channel pattern.
- The MACD and signal lines are merged below the zero line.
- The 24-hour trading volume of Polkadot is $621 Million, marking a 13% fall.
Past Performance of DOT
A bearish reversal after the 8th of February peak at $23 results in an upward trend in the direction of DOT price. However, this reversal in a V shape fell the altcoin by 28.6%, bringing it down to $17.18 support. In addition, the coin chart illustrates a relief rally that raised the price 15.4% higher, reaching the $19.66 mark.  Source-Tradingview
DOT Technical Analysis
DOT price rising within a channel challenges the 50-day EMA and the psychological barrier at $20 as the buyers start a coup. Hence, closing above the resistance confluence will fire a bullish flare shot attracting buyers around the globe. The downsloping EMAs for the 50 and 200-day suggest a strong bearish trend, with the 50-day being an opportunity to rescind the movement upwards. But, a possible break from the 50-day EMA will be able to reach the 200-day EMA, which would result in a rise of 20 percent. MACD Indicator: It appears that the MACD, as well as the signal line, are set to join under the line of zero, which could trigger a bullish crossover. Therefore it is indicating a potential buying signal and will soon announce the possibility of a crossover. RSI Indicator: The RSI slope shows a wavy uptrend approaching the halfway mark and surpassing the 14-day average line. Hence, the indicator reflects a gradual rise in the underlying bullishness. In a nutshell, the DOT technical analysis shows a potential rise to the $22 mark.
Upcoming Trend
DOT coin price projects a bullish reversal within the rising channel, increasing the chances of the rally approaching the $20 mark. Moreover, the breakout of the 50-day EMA will ensure a bullish rally to the next resisting EMA at $21. Resistance Levels: $21 and $24 Support Levels: $18 and $17
 cryptoknowmics.com