In today’s Synthetix, Chainlink, and Kusama technical analysis, candlestick stick arrangements seem to favor bears. However, a recovery above crucial resistance levels may see the LINK price race to $40, while the KSM price could retest $570. On the other hand, the SNX price can reach $25 in the immediate term.
Synthetix
In today’s Synthetix technical analysis, we check the performance of the SNX governance token. Synthetix is one of the most prominent DeFi protocols, enabling the trustless trading of derivatives. This trustlessness is because of smart contracts.
Past Performance
On Apr 6, the SNX token opened at $20.7, dipping slightly to $20.5, before rallying to today’s intraday highs of $22.5.
The token is trading at a two weeks high. However, the uptrend is firm. The SNX/USD price seems to be reversing from Mar 2021 lows.
On the last day, the SNX price is up 11 percent, adding 22 percent on the past week of trading. Notably, it has outperformed both the BTC and ETH in the same period.
Day-Ahead and Tomorrow
As of writing, the SNX price is trading at $21.9, firm within the narrow $2 range. Technically, candlestick arrangement suggests strength. Already, losses of Apr 3 have been reversed.
As from the SNX technical analysis, there are hints of strength. SNX bull bars are beginning to band along the upper BB, suggesting momentum buildup in lower time frames.
At the same time, trading volumes are within average but comparatively high, a foundation for an uptrend.
SNX Technical Analysis
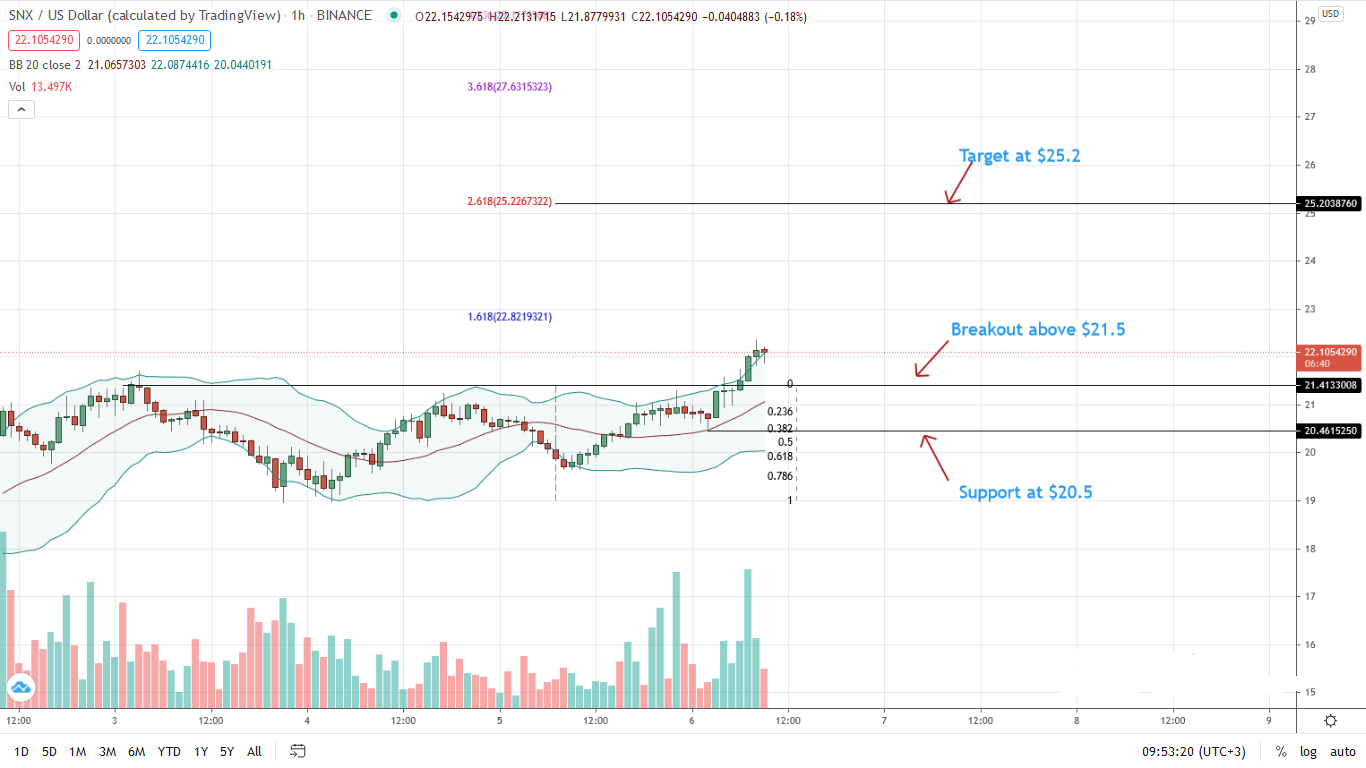
With a burst of trading in the 1-hour chart, the SNX/USD price is trading within a bullish breakout pattern. Immediate support is around $21.5.
However, a pullback to $20.5—Apr 6 lows may provide another opportunity for aggressive traders banking on trend continuation.
A close above $22.5 confirms bulls and may see prices edge higher towards $22.5—the 2.618 Fibonacci extension of the two-day range.
Kusama
The Kusama price is one of the top performers in the top-20. It has nearly the same code-base as Polkadot and allows developers to experiment before deploying on Polkadot. KSM is the native token.
Past Performance
The Kusama price is under pressure but started April firmly.
The KSM price opened at $461, fell to $442 before racing to $469. It is now trading at $454, down one percent from its peak. Still, for the Kusama technical analysis, the coin’s prospects are bullish after Apr 5 performance.
Week-to-date, the Kusama price is down 17 percent but stable on the last trading day.
Day-Ahead and Tomorrow
Despite traders’ optimism, the Kusama price is under pressure.
Trading at $454, it appears bears of late March have the upper hand. There is a reaction at the middle BB, suggesting support.
The middle BB is multi-month support, acting as a buy wall in Q1 2020.
KSM Technical Analysis
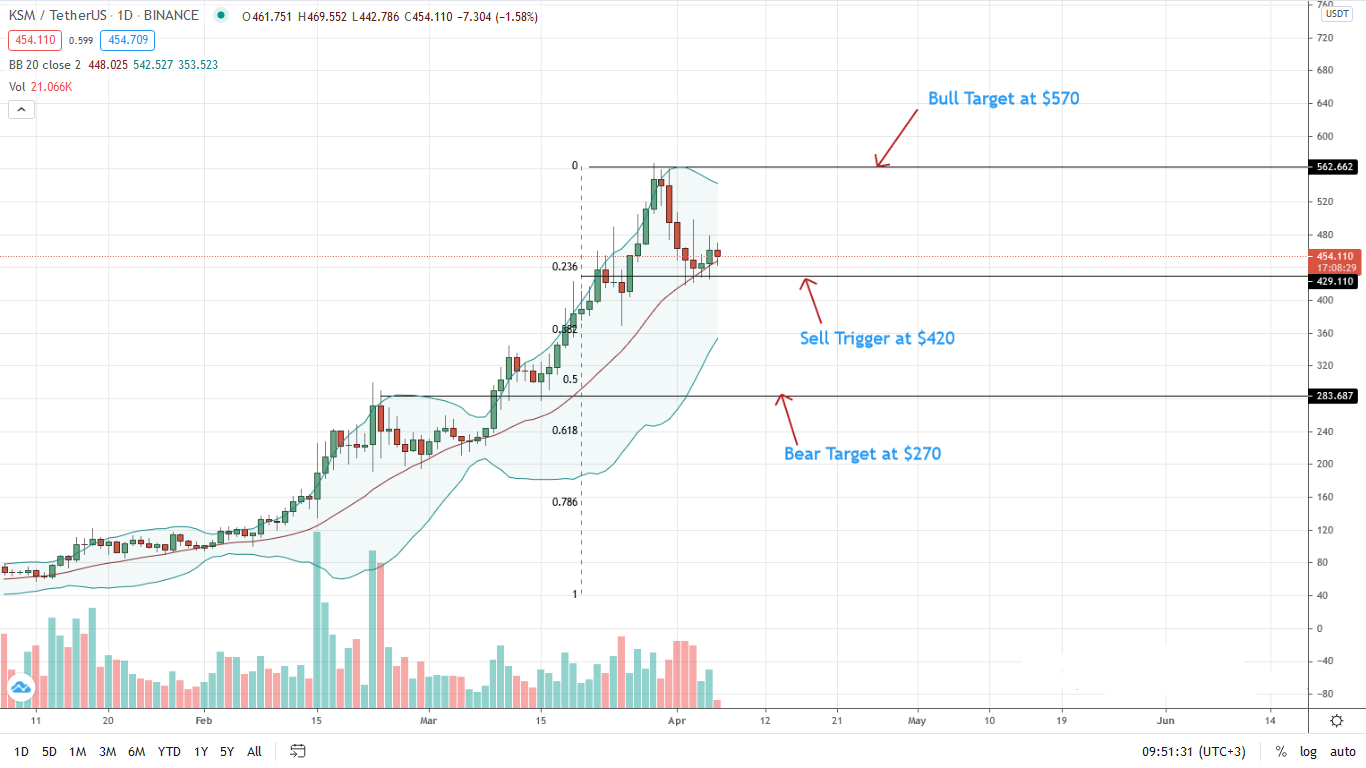
With KSM/USD reacting at the middle BB, buyers stand a chance.
However, with light trading volumes, a confirmation above $500 or Apr 3 highs may see the Kusama price race back to Q1 2021 highs of $570.
On the flip side, a break below the 20-day moving average and $420—the 23.6 percent Fibonacci retracement of the Q1 2021 trade range may spark a sell-off. In that case, the KSM price may collapse to $270 or Feb 2021 highs—around the 50 percent Fibonacci retracement level of the same trade range.
Chainlink
In today’s Chainlink technical analysis, we check the performance of its native token LINK. Chainlink is a decentralized oracle service linking smart contracts with tamper-proof vetted data.
Past Performance
LINK/USD prices are in range mode, trending below $33. On Apr 6, the Chainlink price opened at $33.2, sinking to $31.5 before recovering to $32.7. The token is now trading at $31.7 and under pressure. Week-to-date, the token is up 11 percent, adding five percent on the last trading day.
Day-Ahead and Tomorrow
As of writing, the LINK/USD price is mainly ranging with caps at $33 on the upside. Candlestick arrangement suggests directionless in a largely bearish formation.
BB is almost flat, pointing to low volatility.
Concurrently, volumes have been decreasing since late Feb, suggesting to cautious, non-committal traders.
LINK Technical Analysis
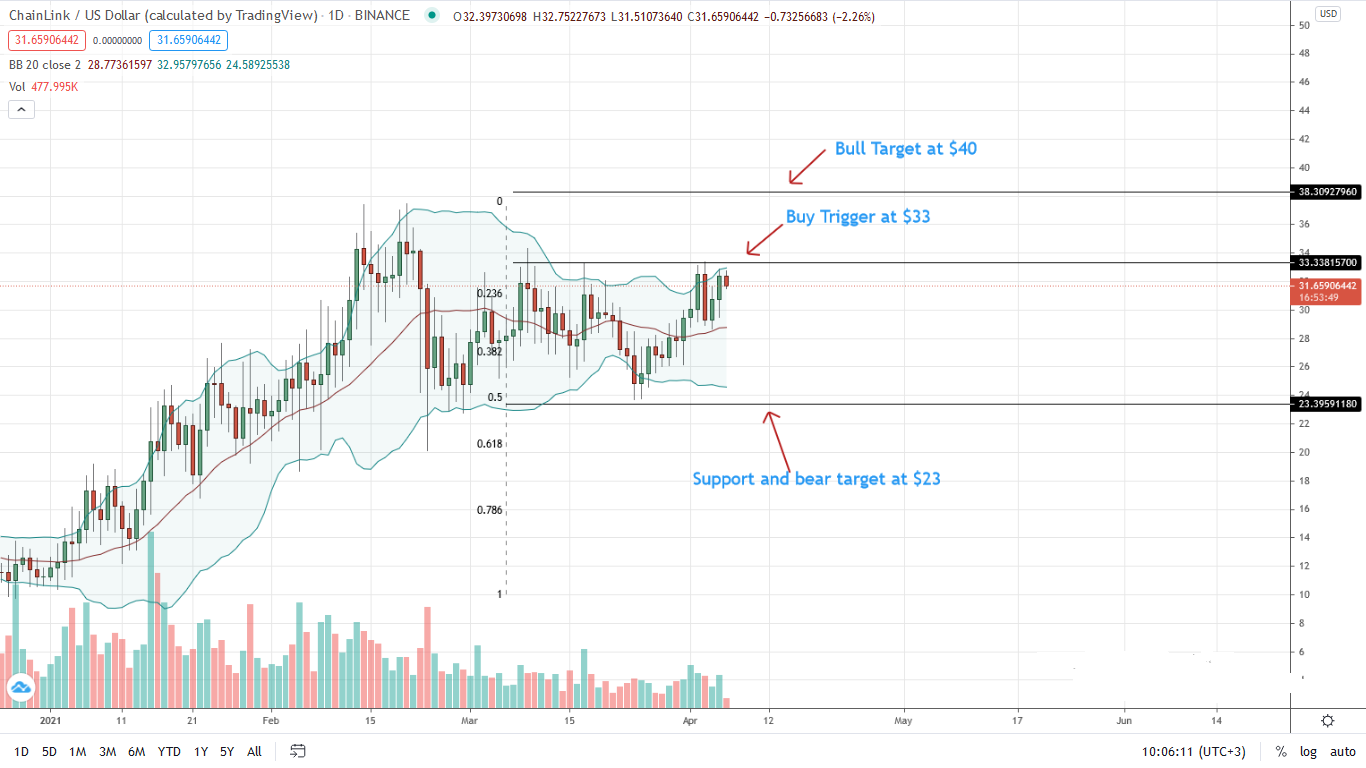
The LINK/USD price is trading inside Feb 23 bear bar. Therefore, from volume analysis, this is bearish. However, a close above the last five-week trade range and $33 may see the LINK/USD race towards $40 and a new all-time high.
Conversely, losses below $28 may see the Chainlink price drop to $24 as prices remain wavy.