1INCH coin price faces rejection from the $2 mark resulting in a fall to $1.50. Will bulls manage to recover trend control and crack $2? Key technical points:
- The 1INCH price clings to the $1.50 support.
- In addition, the market price struggles to surpass the 50-day EMA.
- Finally, the 24-hour trading volume of 1Inch is $89.91 Million, marking a 30% rise.
Past Performance of 1INCH
1INCH coin price action showcased a bullish reversal starting from $1.24, accounting for a 60% rise within a month and reaching the $2 mark. However, the uptrend experienced a massive supply available above the psychological barrier resulting in a 23% in a week to $1.50. 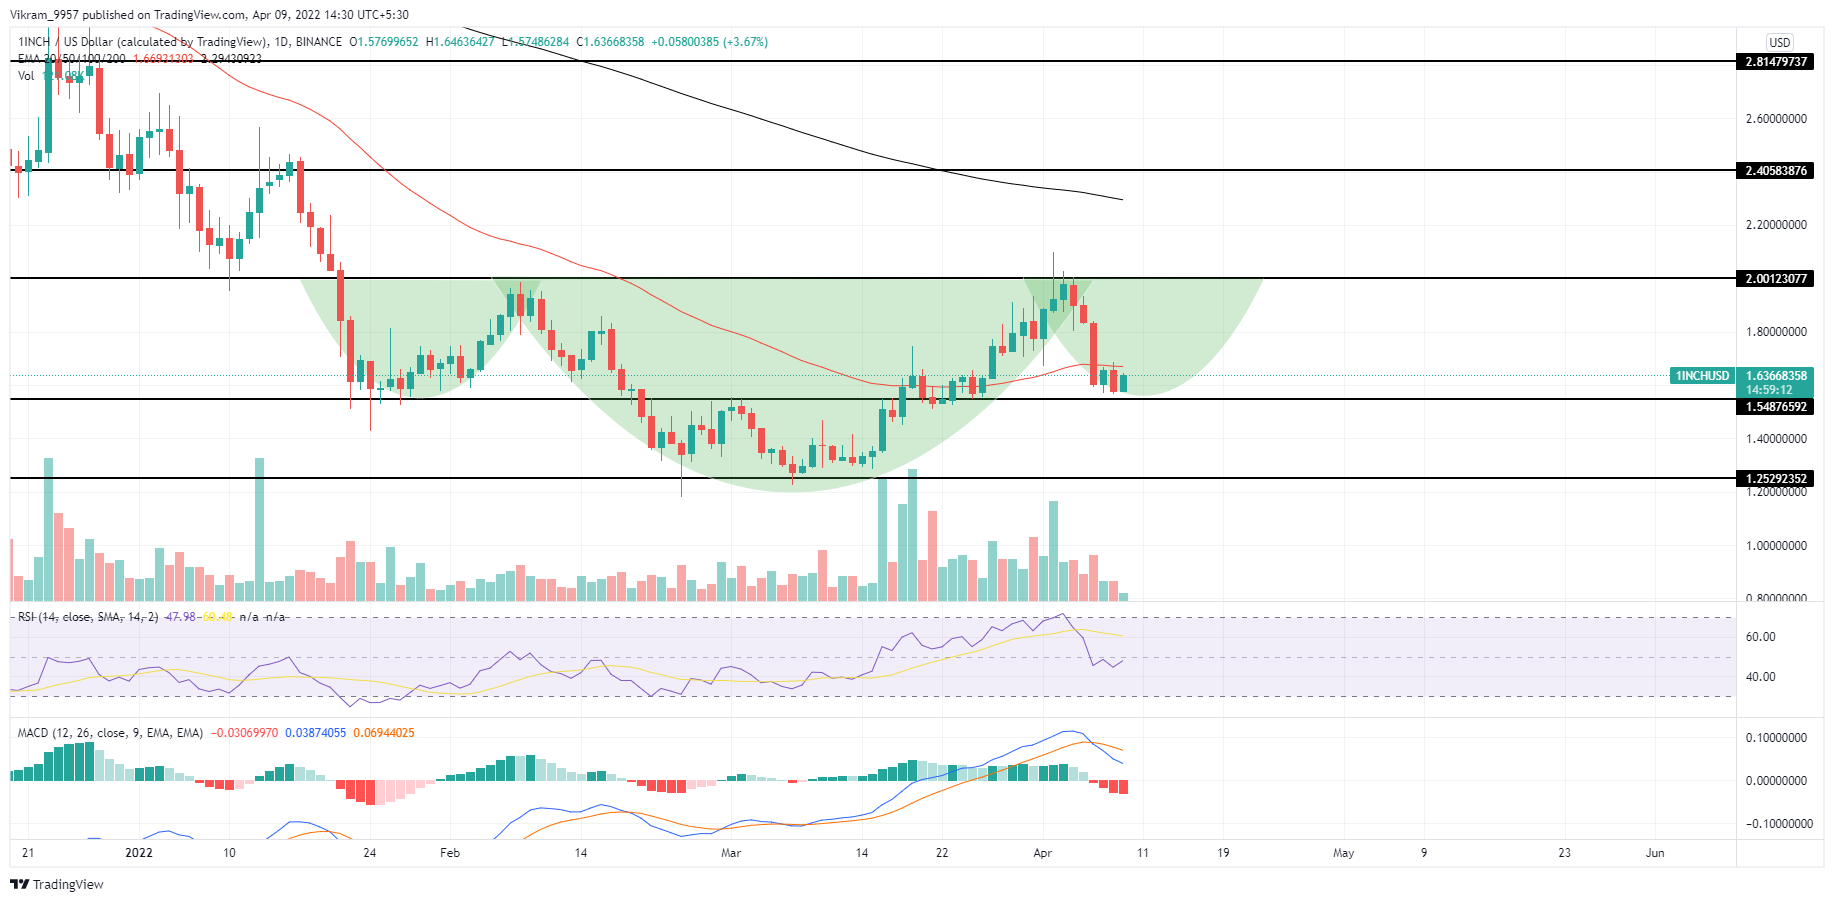 Source-Tradingview
1INCH Technical Analysis
1INCH coin price shows a consolidation range forming between the $1.50 mark and the 50-day EMA in the daily chart. However, the increased bearishness evident by the engulfing candlestick projects the possibility of the $1.50 fallout. The crucial daily EMAs (50, 100, and 200 days) maintain a bearish alignment with the 50-day EMA providing dynamic resistance to keep the consolidation intact. Hence, the EMAs supply to support the bullish growth in check. RSI Indicator: The RSI slope shows an evident bullish divergence in the last two peaks formations at the $2 mark. However, the RSI value is under the halfway mark reflecting the recent surge in bearishness. In a nutshell, the 1INCH technical analysis highlights the probability of an inverted head and shoulder formation with a neckline at $2.
Upcoming Trend
1INCH coin price reaching the $2 mark if the buyers step in at $1.50 will complete the inverted head and shoulder pattern. Hence, short-term traders can buy at market price with a target of $2, but prices breaking above $2 will extend the target to $2.40. Support Levels: $1.5 and $1.25 Resistance Levels: $2 and $2.40