- Uniswap price analysis is bearish today
- The strongest resistance is present at $12.3.
- Uniswap trades at $10.4 as of now.
Uniswap price analysis is currently in a predominantly downward trend, falling below the $11 level and expected to fall even further. Following its drop to the $10.7 mark on April 5, 2022, when it dropped from $11.8 to $10.7, UNI/USD reversed course and fell rapidly for a few days. It found support at $9.8 on April 8 and bounced back to $10.4, currently trading.
The price of UNI/USD is expected to continue falling in the short term as the market remains bearish. The strongest resistance is present at $12.3, which was tested on April 4 and 5. If the price of UNI/USD breaks below $10, it could fall to $9.5 or lower.
The price of UNI/USD is currently in a largely downward trend, falling below the $11 level and expected to fall even further. Following its drop to the $10.7 mark on April 5, 2022, when it dropped from $11.8 to $10.7, UNI/USD reversed course and fell rapidly for a few days. It found support at $9.8 on April 8 and bounced back to $10.4, currently trading.
The price of UNI/USD is expected to continue falling in the short term as the market remains bearish. The strongest resistance is present at $12.3, tested on April 4 and 5. If the price of UNI/USD breaks below $10, it could fall to $9.5 or lower.
UNI/USD 4-hour price analysis: Latest developments
The Uniswap price analysis indicates that market volatility follows a significantly increasing trend, making Uniswap prices more vulnerable to volatile changes on either extreme. The upper limit of the Bollinger’s band is available at $12.3, which acts as the most substantial resistance for UNI. The lower limit for the Bollinger’s band is available at $10.6, which serves as another point of resistance rather than support for UNI.
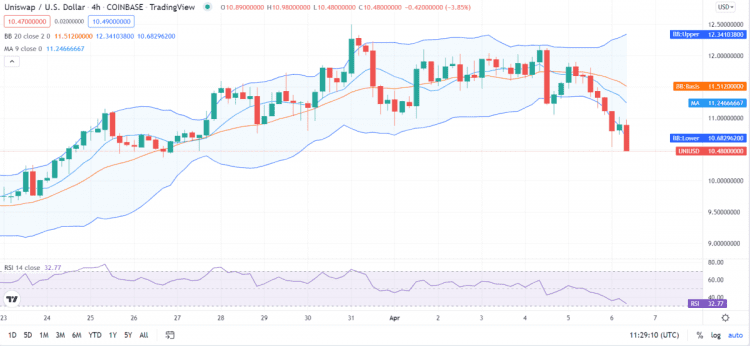 UNI/USD 4-hour price chart source: TradingView
According to the Uniswap price analysis, the Relative Strength Index (RSI) is 32, suggesting that UN/USD is considered oversold and qualifies for the undervalued category. The RSI score appears to be declining, suggesting a growing market tendency toward stability. Because selling activity gains momentum over buying activity, the RSI score goes down, a bullish sign.
The 4-hour MACD for UNI/USD is in the bearish zone as the signal line (blue) is above the histogram and the MACD line (black). This indicates that the price is likely to see more downward momentum soon.
Uniswap Price Analysis for 1-day: UNI/USD suffers devaluation
According to the Uniswap price analysis, market volatility is downward, which suggests that Uniswap prices are becoming less volatile. The Bollinger’s band has an upper bound of $12.3, which serves as the UNI resistance point. Conversely, the lower limit of Bollinger’s band is $9.
The UNI/USD pair appears to be crossing underneath the Moving Average curve, implying a bearish trend. The price path seems to be moving substantially below the Moving Average curve, suggesting solid bearish momentum. If the price trajectory reaches this point, it will attempt to break the market’s support, which would start a reversal if it comes into action.
The RSI for UNI/USD is at 42, which is in the neutral territory. This suggests that the market is neither overbought nor oversold. The MACD line is below the signal line, indicating a bearish trend.
The 4-hour MACD suggests that the price is likely to see more downward momentum soon,
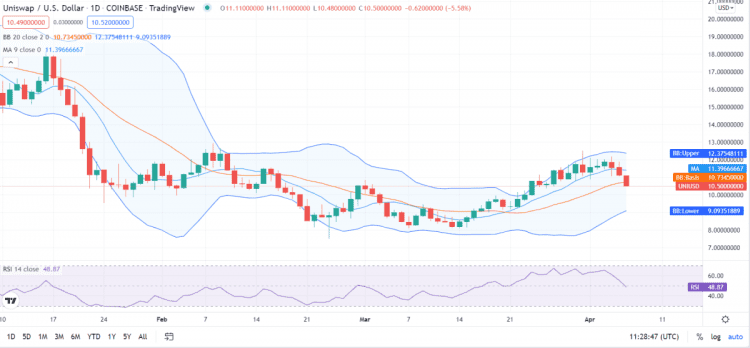
UNI/USD 1-day price chart source: TradingView
The Relative Strength Index (RSI) is 48, indicating that the cryptocurrency is entering a stable domain in the Uniswap price analysis. Furthermore, according to the RSI’s downward trajectory and bear dedication.
The 4-hour MACD for UNI/USD is in the bearish zone as the signal line (blue) is above the histogram and the MACD line (black). This indicates that the price is likely to see more downward momentum soon.
The market is bearish, and the price is expected to continue falling. The strongest resistance is present at $12.3, tested on April 4 and 5. If the price of UNI/USD breaks below $10, it could fall to
The market is bearish, and the price is expected to continue falling. The strongest resistance is present at $12.3, tested on April 4 and 5. If the price of UNI/USD breaks below $10, it could fall to $9.5 or lower.
Uniswap Price Analysis: Conclusion
The Uniswap price analysis reveals that UNI/USD is currently in a downward trend. The market appears to be bearish, and the price is expected to continue falling in the short-term. The strongest resistance is present at $12.3, while the next support level is at $10.
Disclaimer. The information provided is not trading advice. Cryptopolitan.com holds no liability for any investments made based on the information provided on this page. We strongly recommend independent research and/or consultation with a qualified professional before making any investment decisions.