Cosmos (ATOM) is a cryptocurrency that powers an ecosystem of blockchains designed to scale and interoperate with each other. The team aims to create an Internet of Blockchains, a network of blockchains able to communicate with each other in a decentralized way. Cosmos is a proof-of-stake chain. ATOM holders can stake their tokens to maintain the network and receive more ATOM as a reward.
Past Week’s Performance of ATOM
The opening price of ATOM on February 12, 2021, was $17.72. As of February 18, 2021, ATOM closed at $23.09. Thus, the ATOM price has surged by roughly 30% in the past week.
In the last 24 hours, ATOM is trading between $21.50-$25.13.
https://www.tradingview.com/x/yAJUWOb3
Technical Indications for the Day-Ahead and Tomorrow
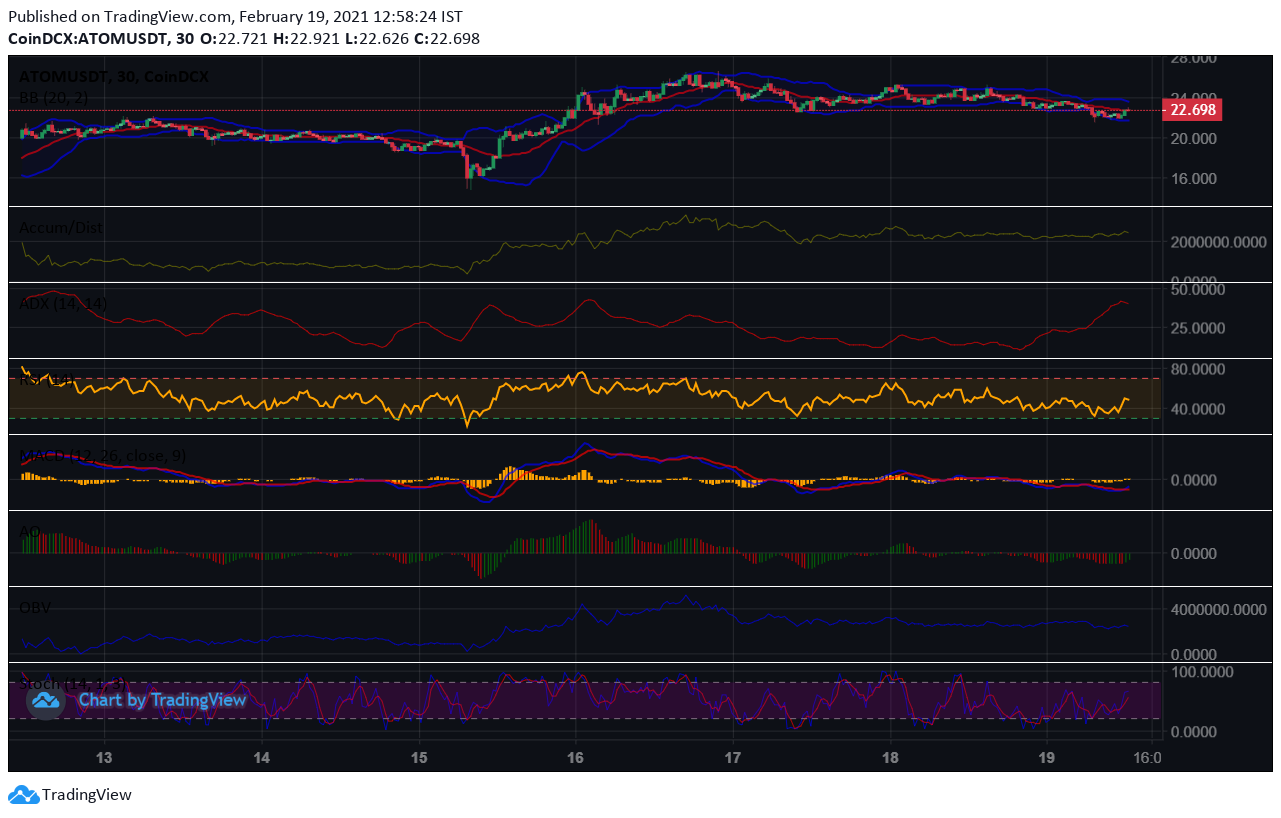
Currently, ATOM is trading at $22.70. The price has fallen from the opening price of $23.09 and is in a downtick.
It is trading closer to the upper Bollinger band. It is also above the 20-day SMA line. The A/D and OBV indicators have started rising steadily over the past hour. Thus, buying pressures are slowly mounting. It may soon overtake the market and the price may go up.
The Stochastic oscillator is in the ‘overbought’ region indicating high demand for ATOM. However, a bearish crossover by the actual value-line over the 3-day SMA line has occurred. Thus, there may be a price pullback. The stochastic oscillator will start falling too. It is a good time for swing traders to accumulate ATOM.
A similar picture is painted by the RSI indicator. The RSI indicator is currently at 66%. It faced a bearish swing rejection at 70% and has started falling again. So, the selling pressures are high and both the RSI and stochastic oscillators are pointing towards a price pullback.
The AO indicator is positive and shows strong ‘buy’ signals. The MACD and signal lines are also positive. A bullish crossover by the MACD line over the signal line indicates a positive price trend. In short, the market momentum looks bullish, but there will be intermittent price corrections.
However, the ADX indicator is falling. The price uptrend shown by some indicators is not strong yet. Thus, the price may struggle to rise.
Currently, ATOM is trading below the Fibonacci pivot point of $23.24. If it breaks out of the first Fibonacci pivot resistance level of $24.63 in some time we can be assured that the bull-run will continue.
Presently, the price is testing the 61.8% FIB retracement level of $22.88. If it manages to surpass the 38.2% and 23.6% FIB retracement levels of $23.74 and $24.27, respectively, by today, then the positive trend will continue tomorrow as well.