AAVE had been on a downward trend. It is an open-source and non-custodial liquidity protocol for earning interest on deposits and borrowing assets. The idea is to create an open structure in payments with security.
Past Performance of AAVE
On February 12, 2021, AAVE started trading at $517.91. As of February 18, 2021, AAVE closed at $441.50. Thus, the AAVE price has dipped by approximately 15% in the past week.
In the past 24 hours, AAVE has been trading between $421.80-$480.
https://www.tradingview.com/x/z3hTjRh9
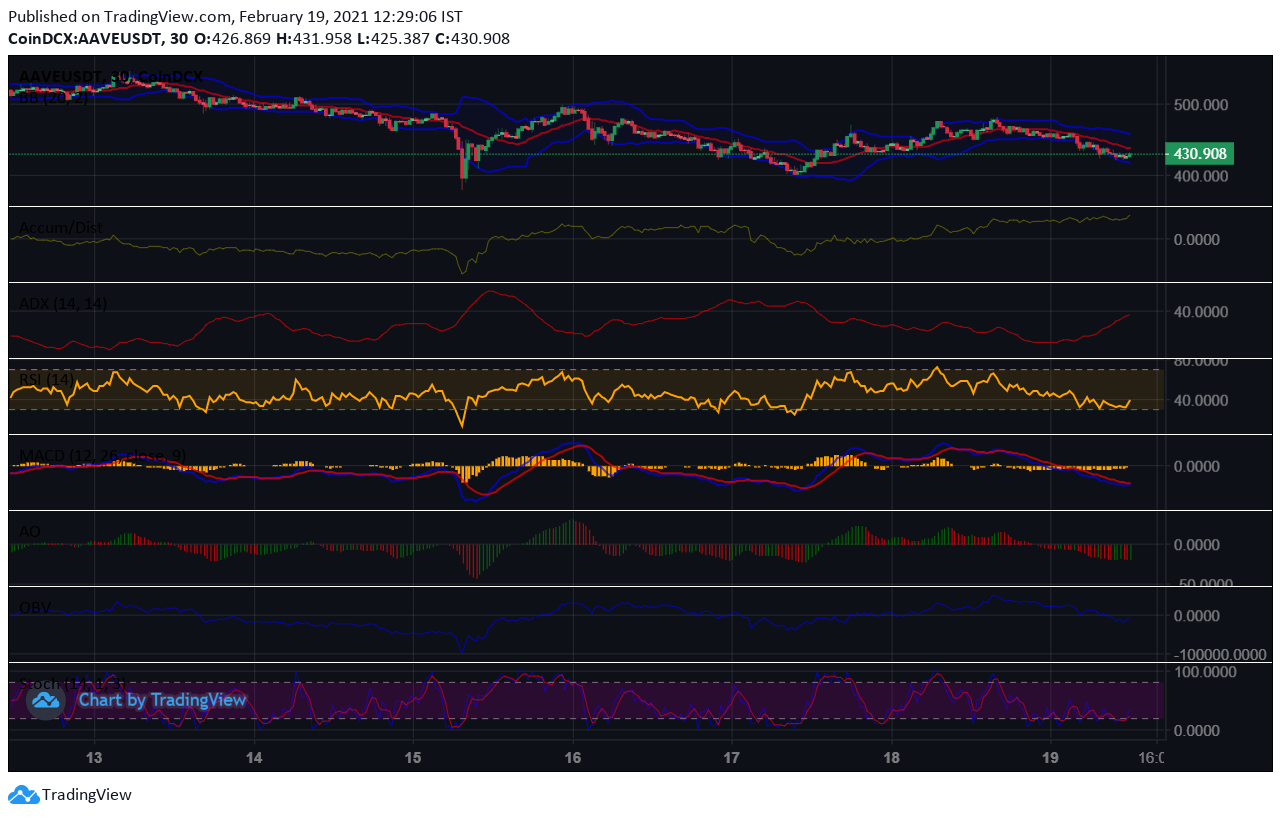
Technical Indications for the Day-Ahead and Tomorrow
Currently, AAVE is trading at $430.91. The price is downtick as it has fallen from the opening price of $441.50. The price is closer to the lower Bollinger band and below the 20-day SMA. Thus, selling pressures are very high. The price is likely to dip further.
The A/D and OBV indicators have fallen steeply. Thus, whale offloading is high. In short, distributions are more than accumulations. High selling activity will exert downward pressure on the AAVE price.
The ADX indicator is also falling. Thus, the bearish trend is strong. A trend reversal looks unlikely as the market is steadily losing breath.
However, the RSI indicator is at 60%. A couple of hours back it had touched the 30% mark and rallied thereafter. It is gradually moving towards the 70% mark. This indicates that buying pressures are slowly mounting. There may be a brief price rise before it starts falling again.
The Stochastic oscillator gives similar indications. The actual value and 3-day SMA lines have just rallied from the oversold region. In fact, presently, they have entered the ‘overbought’ territory. Thus, price corrections are occurring.
A bearish crossover by the actual value-line over the 3-day SMA line indicates that the price will start falling. The stochastic will also start falling. It is a good time for swing traders to go short.
The AO has just crossed above the zero line and turned positive. The ‘buy’ signals are slowly gaining momentum. The MACD and signal lines are also likely to turn positive soon. A bullish crossover by the MACD line over the signal line points towards a price rise.
Currently, AAVE is trading way below the Fibonacci pivot point of $447.69. It may fall below the subsequent Fibonacci pivot support levels of $425.45 and $411.72 respectively, by the end of the day.
The price may test the 23.6% FIB retracement level of $435.53, before resuming its price downtrend. As of now, the bear-run is strong. So any intermittent price rise is just a market price adjustment mechanism. We can expect the price to continue its downtrend tomorrow as well.