TRON (TRX) is in the process of breaking out from a long-term resistance area, found at $0.043.
TRON is expected to be successful in closing above this resistance and gradually move towards the target levels outlined below.
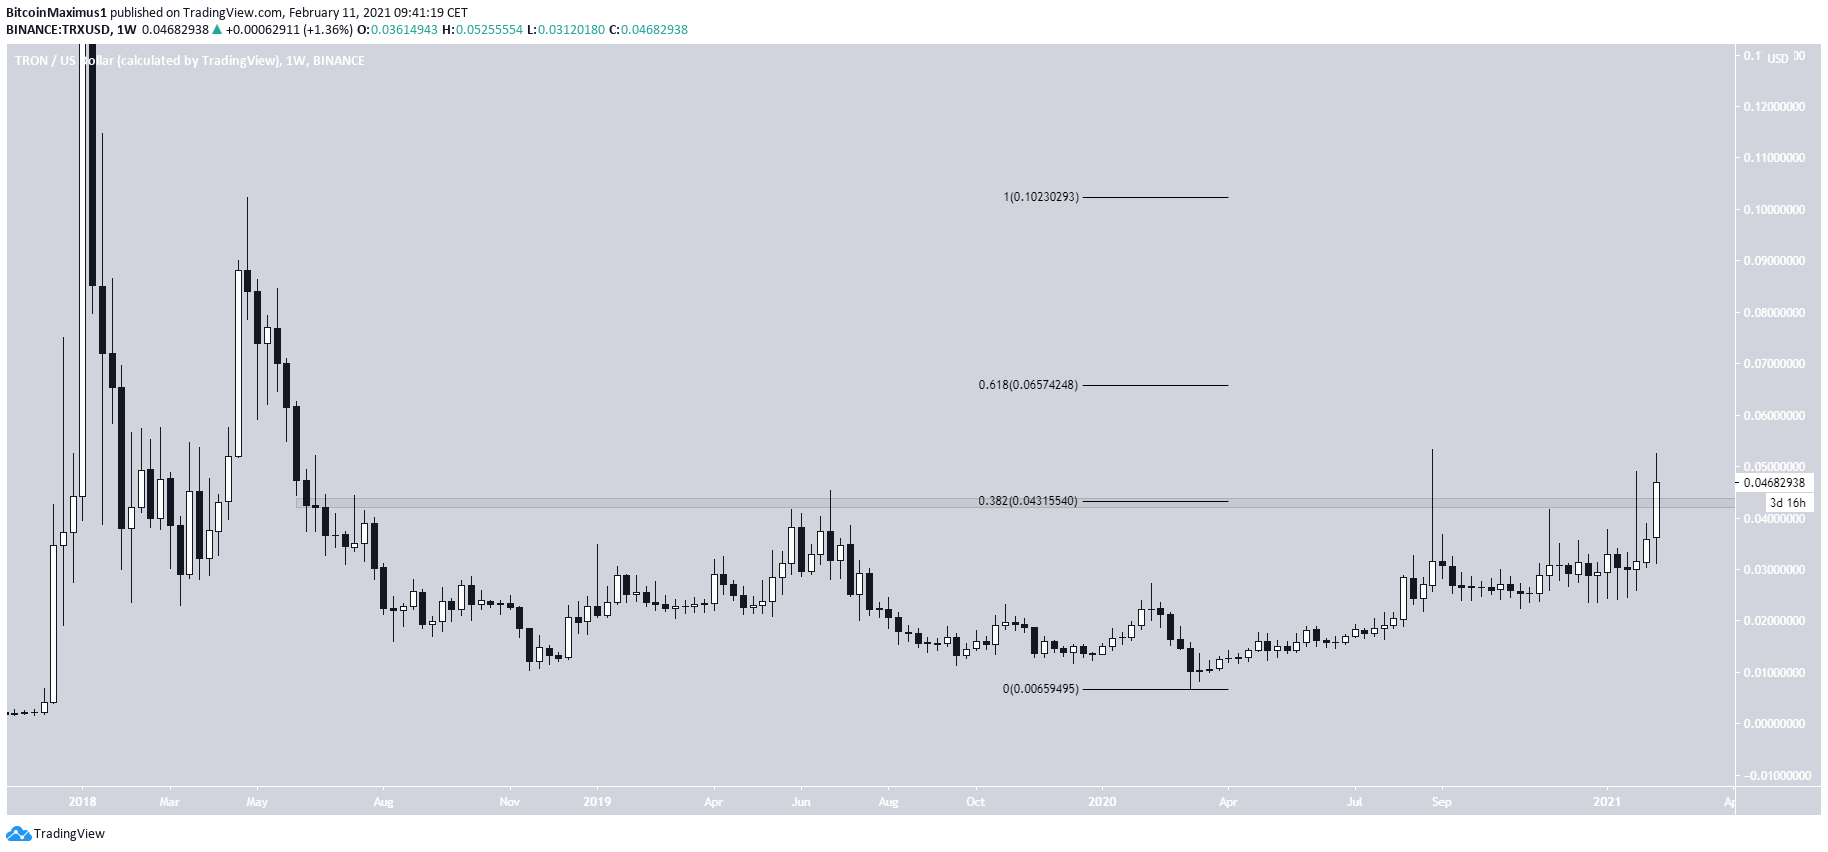
TRON Long-Term Breakout
TRX has been on an upward movement since reaching a three-year low in March 2020.
Despite the considerable increase, TRX still has not reached a weekly close above the $0.043 resistance level that has been in place since May 2018. Up to this point, TRX has made four unsuccessful attempts at breaking out.
However, TRX is currently above the aforementioned resistance and seems to be ready to reach a close above it.
If TRX moves above this area, the next closest resistance areas would be found at $0.065 and $0.10.
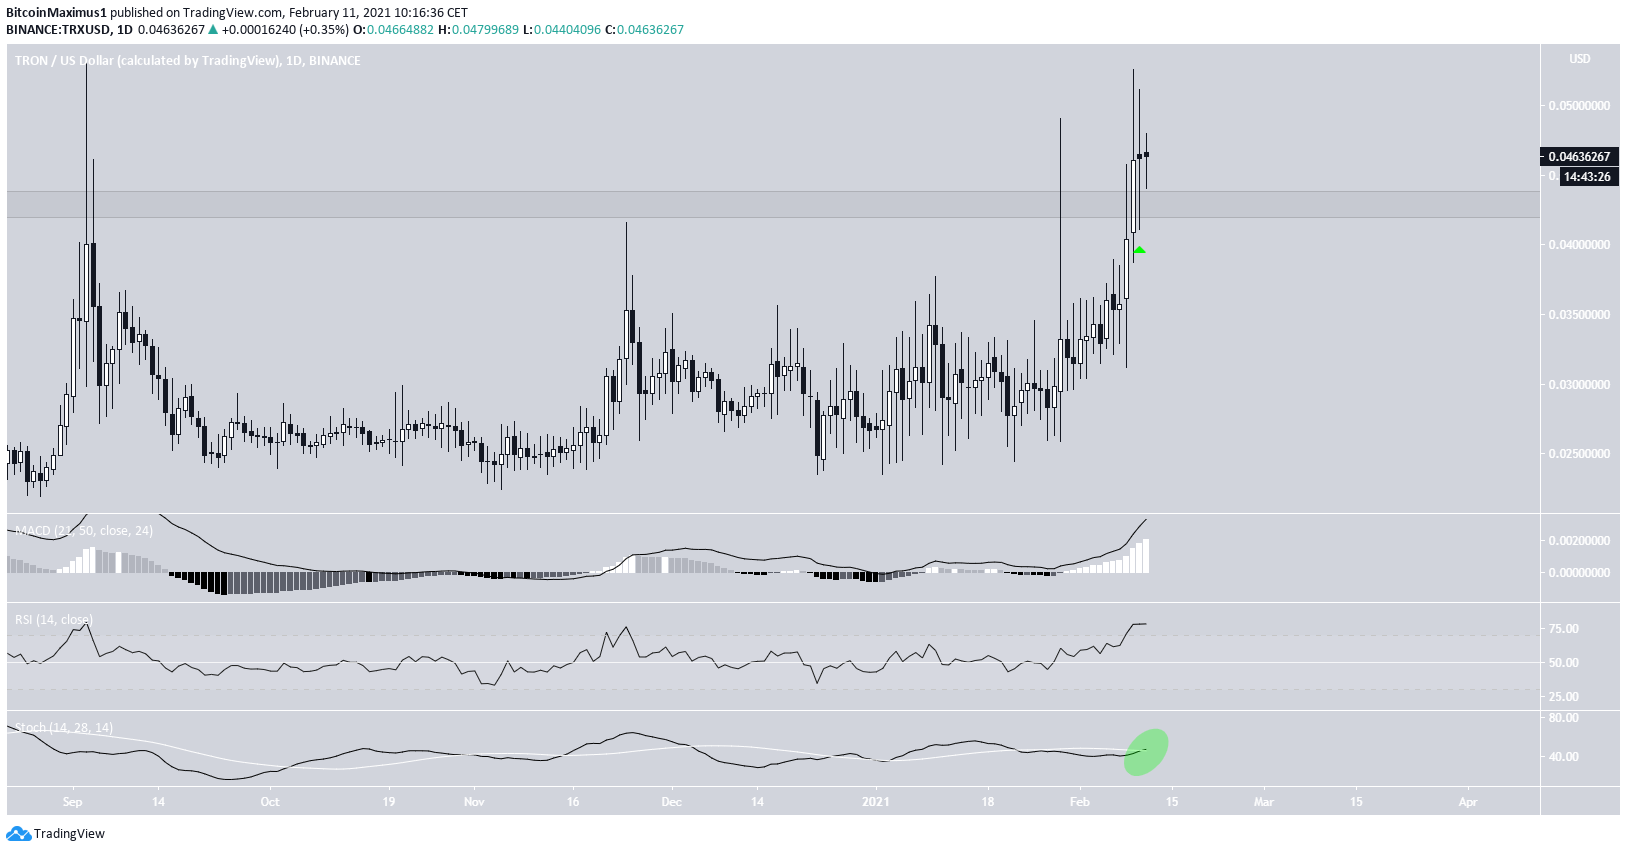
Current Movement
The daily chart supports this possible scenario.
First, we can see that TRX has already moved above the resistance area and validated it as support in the daily time-frame.
Furthermore, technical indicators are bullish. This especially visible in the bullish cross in the Stochastic oscillator (green circle) and the RSI crossing above 70.
Therefore, TRX is expected to increase towards the resistance levels outlined in the previous section, located at $0.065 and $0.10.
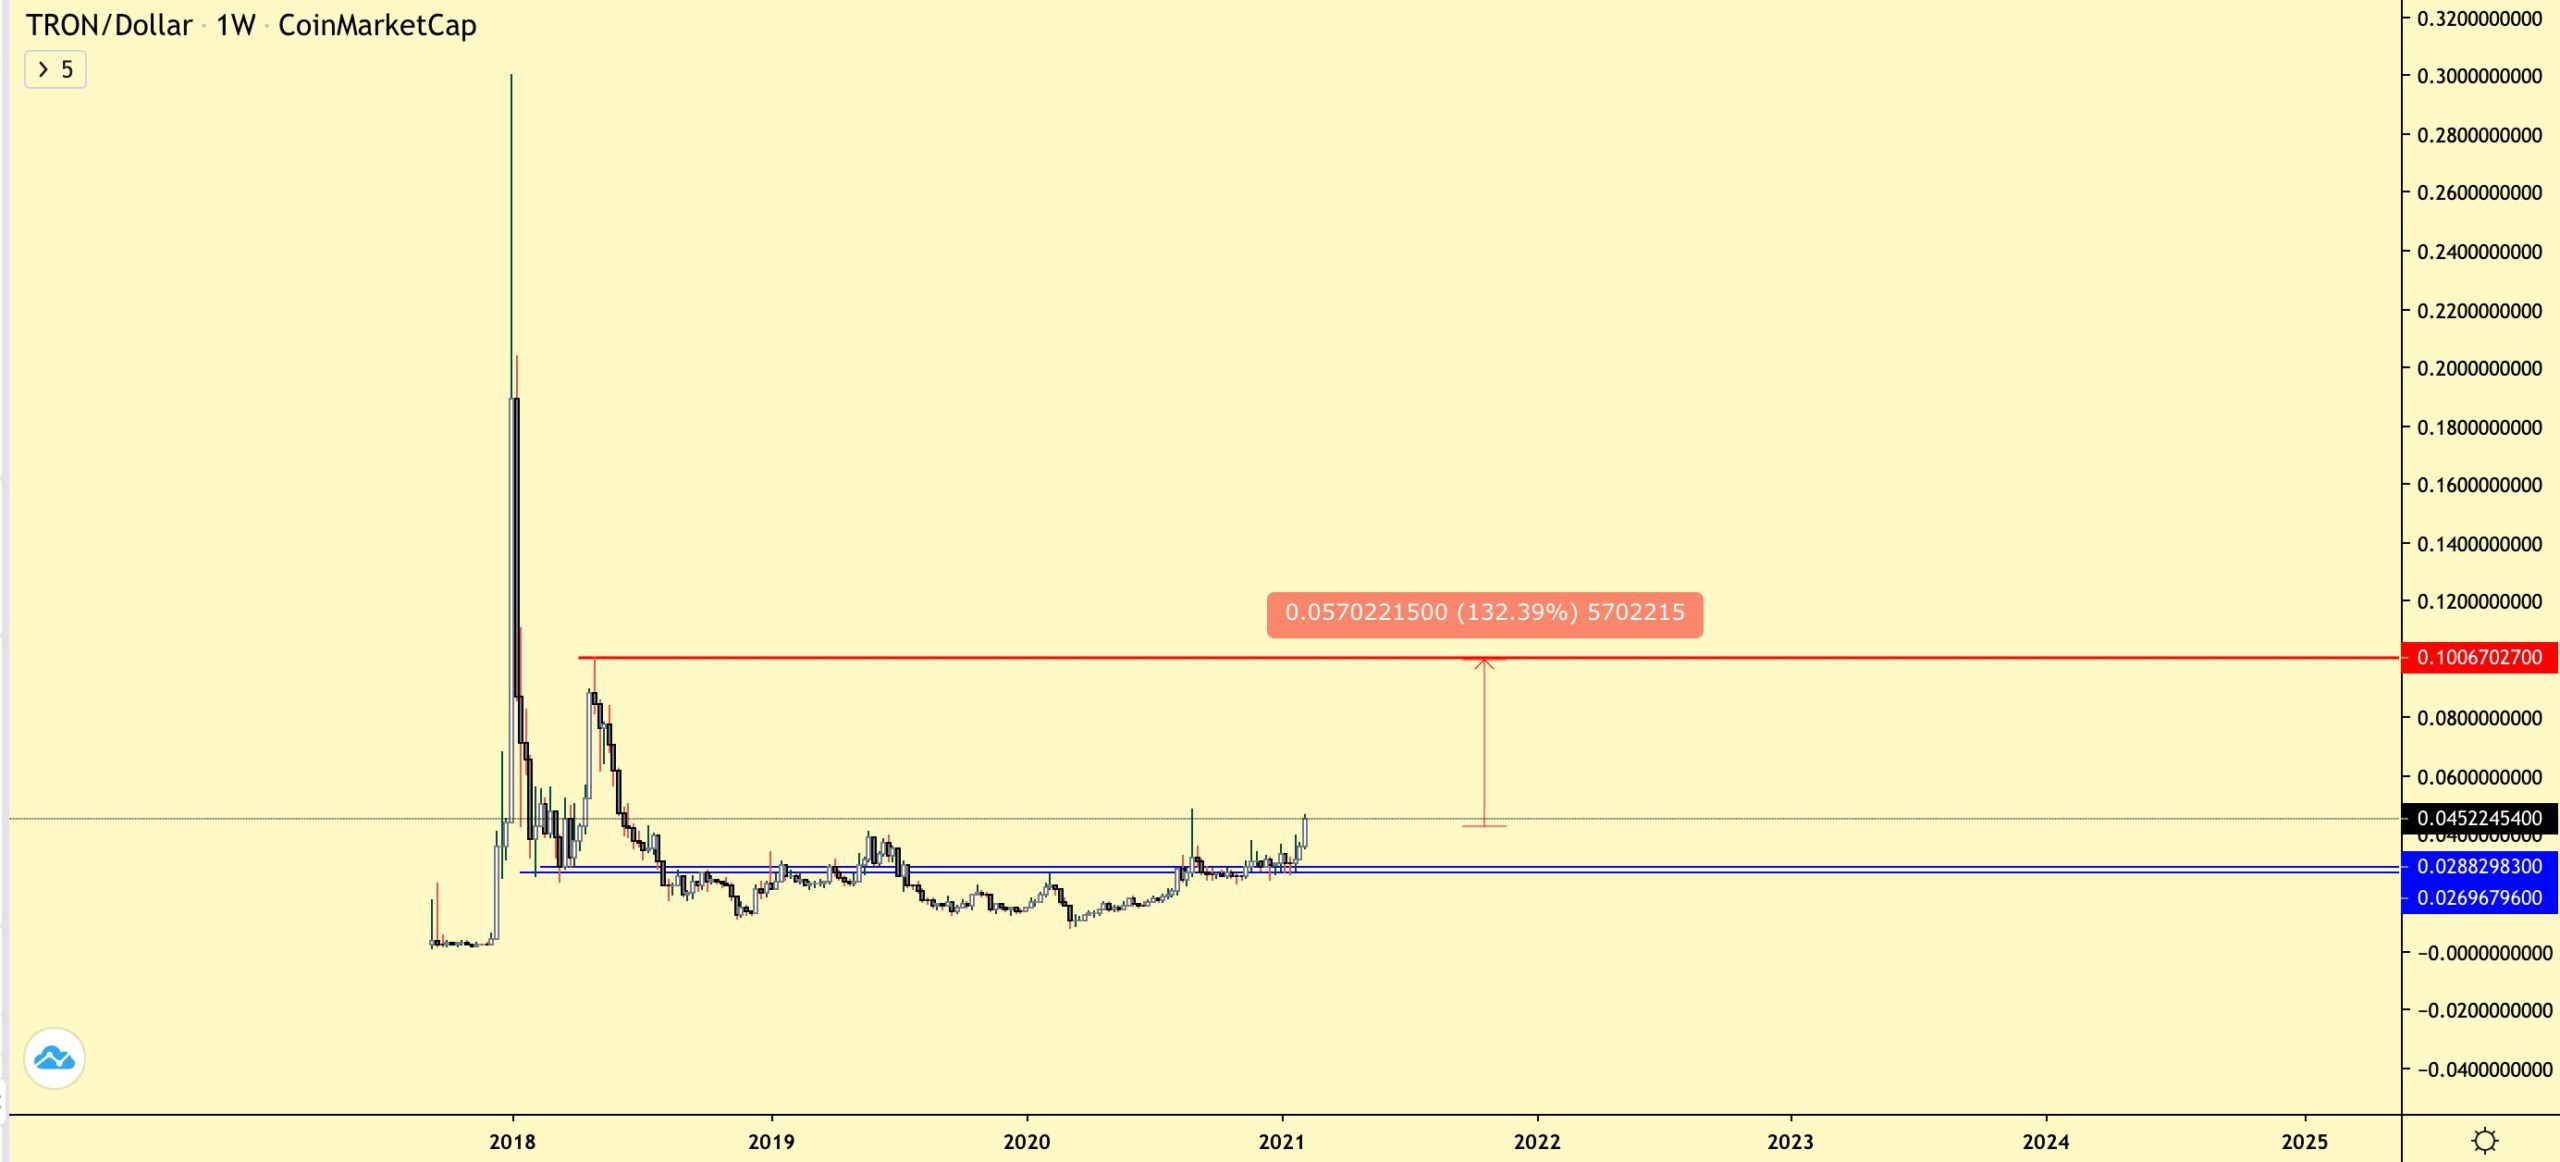
TRX Wave Count
Cryptocurrency trader @AltstreetBet outlined a TRX chart, which has a top target near $0.10.
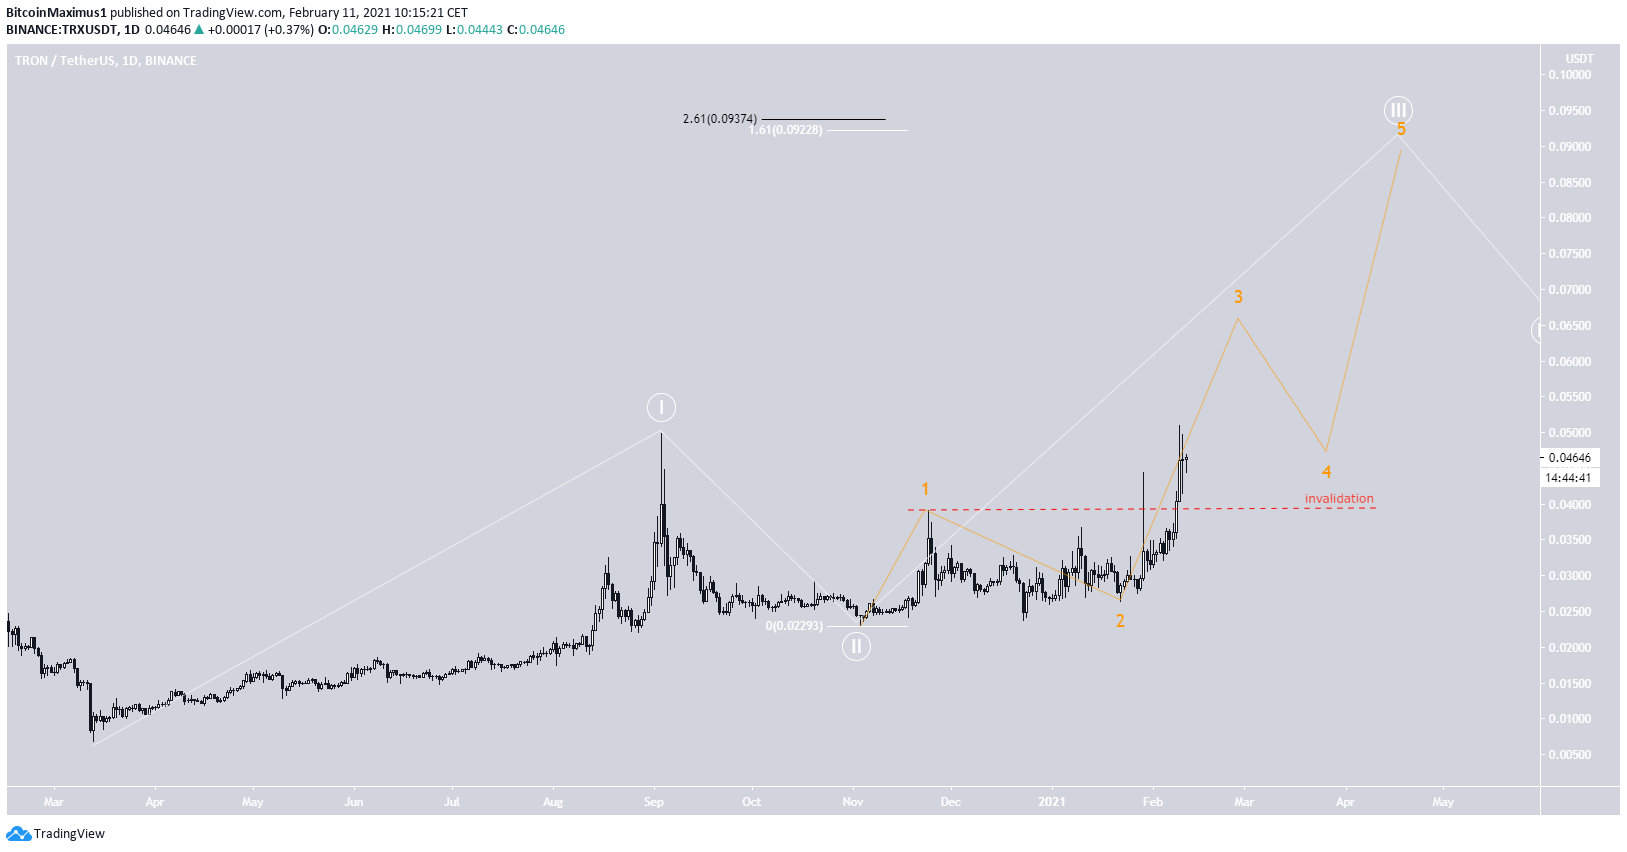
The wave count suggests that TRX is in an extended wave three of a bullish impulse that began in March 2020
The most likely target for the top of the upward move is found between $0.092-$0.093, which would give waves 1:3 a 1:1.61 ratio. Furthermore, it’s also the 2.61 external Fib retracement for wave two.
The sub-wave count is shown in orange. A decrease below the sub-wave one high at $0.039 would invalidate this particular wave count.
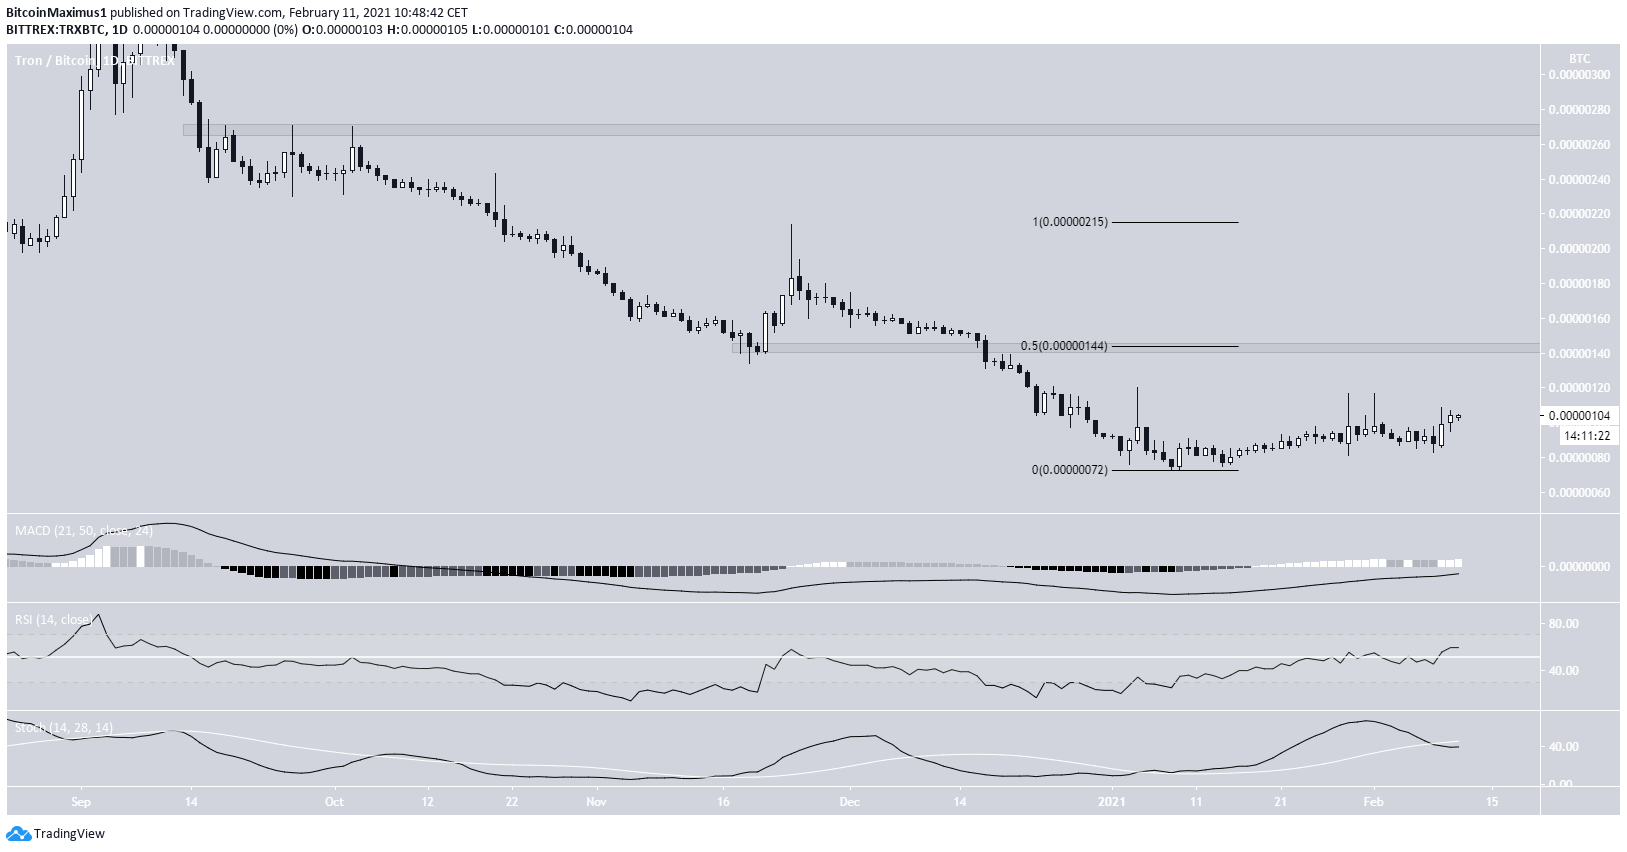
TRX/BTC
On Jan. 8, 2021, TRX/BTC reached a low of 72 satoshis. It has been gradually increasing since and is currently trading at 104 satoshis.
Technical indicators provide mixed signals. While the MACD and RSI are bullish, the Stochastic oscillator has made a bearish cross.
The closest resistance areas are found at 144 satoshis and 270 satoshis.
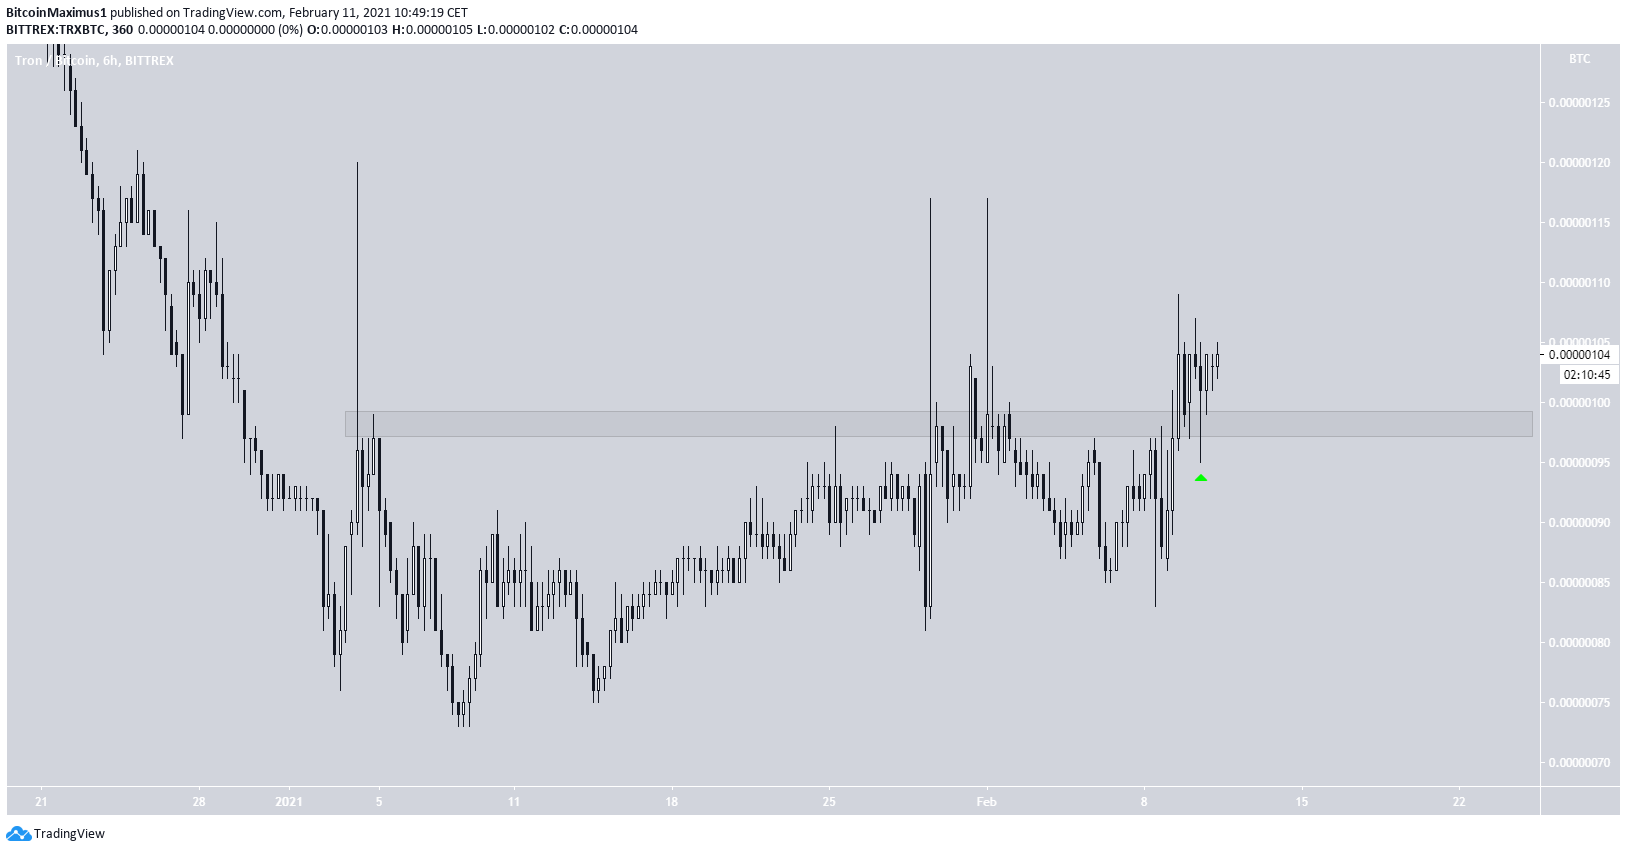
The six-hour chart supports the possibility of an upward move being initiated, since it shows a breakout and re-test of the 98 satoshi resistance area.
Therefore, TRX/BTC is expected to move towards 144 satoshis.
Conclusion
TRX/USD is expected to confirm the breakout from the $0.043 resistance area and gradually move towards $0.065. It could potentially climb to the neighborhood of $0.10.
TRX/BTC is expected to move towards 144 satoshis, though the direction of the long-term trend is not yet clear.