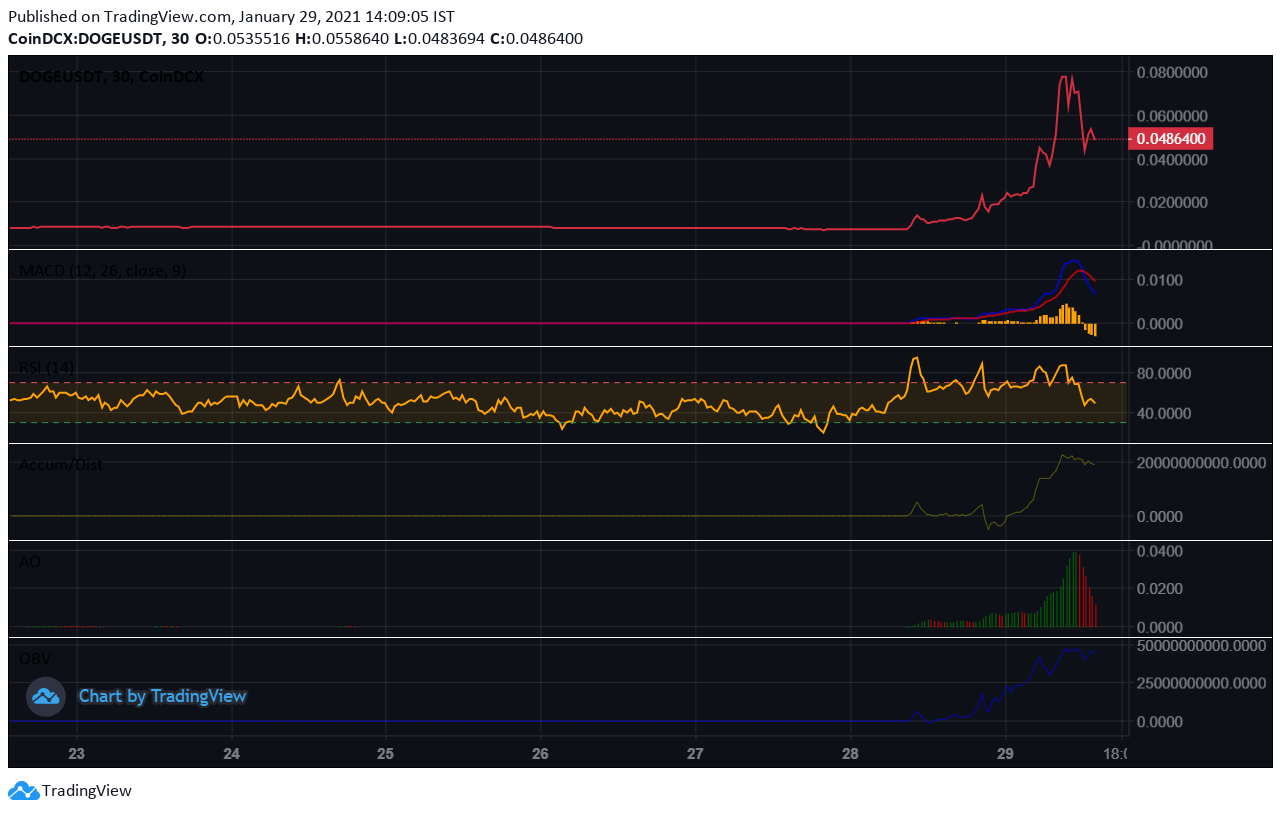
After showing neutral trading activity till 28th January, DOGE prices started rising phenomenally. There was a record 800% surge in DOGE price.
The Past Week
On 29th January, the price touched approx. $0.08 and thereafter started falling. An uptrend was expected, but the price fell instead. This plunge is mainly attributed to “Robinhood” halting instant deposits for crypto purchase citing ‘extraordinary market conditions’. Reddit group SantoshiStreetBets, which was largely responsible for the DOGE price surge is urging crypto investors to hold on to DOGE.
As of 1st February, the closing price of DOGE was $0.034.
https://www.tradingview.com/x/JitocwZs
Predictions for the Days Ahead
Currently, DOGE is trading at $0.033. Its opening price today was $0.035.
The OBV and A/D indicators are rising. The OBV rising but the price falling implies positive divergence. Thus, a price downtrend will not sustain for long. Similarly, the A/D line rising while the price is falling indicates buying pressures. So, the downtrend is likely to reverse soon. The AO indicator is treading above the ‘zero’ line. This implies ‘buy’ signals. So, if buying overtakes selling, a bullish trend will set in.
During early hours of trade, both the MACD and signal lines were below zero line. In other words, their values were negative. But, now they are above the zero line and thereby positive. This is another indication of buying pressures dominating selling pressures. Currently, the MACD and signal line have converged. In other words, they are having the same value. A noticeable ‘bullish’ or ‘bearish’ crossover hasn’t occurred.
The RSI indicator is at 49%. Price faced a bearish swing rejection signal at 70%. An RSI value below 50% implies going short. Thus, in contrast to other indicators, the RSI indicator is giving credence to a price downtrend.
Both the SMA and EMA are above the price line. This is a positive sign implying that the DOGE price is on an upswing. If you observe the Bollinger bands, the price is moving towards the upper band indicating that the crypto is being ‘overbought’. Thus, the price is on an uptick.
Currently, DOGE is trading below the Fibonacci pivot level of $0.036. If the price successfully manages to break out of the three Fibonacci resistance levels of $0.041, $0.045, and $0.051 respectively by tomorrow, an uptrend can be sustained. If the price falls below the first Fibonacci support level of $0.03, then the downtrend will continue.