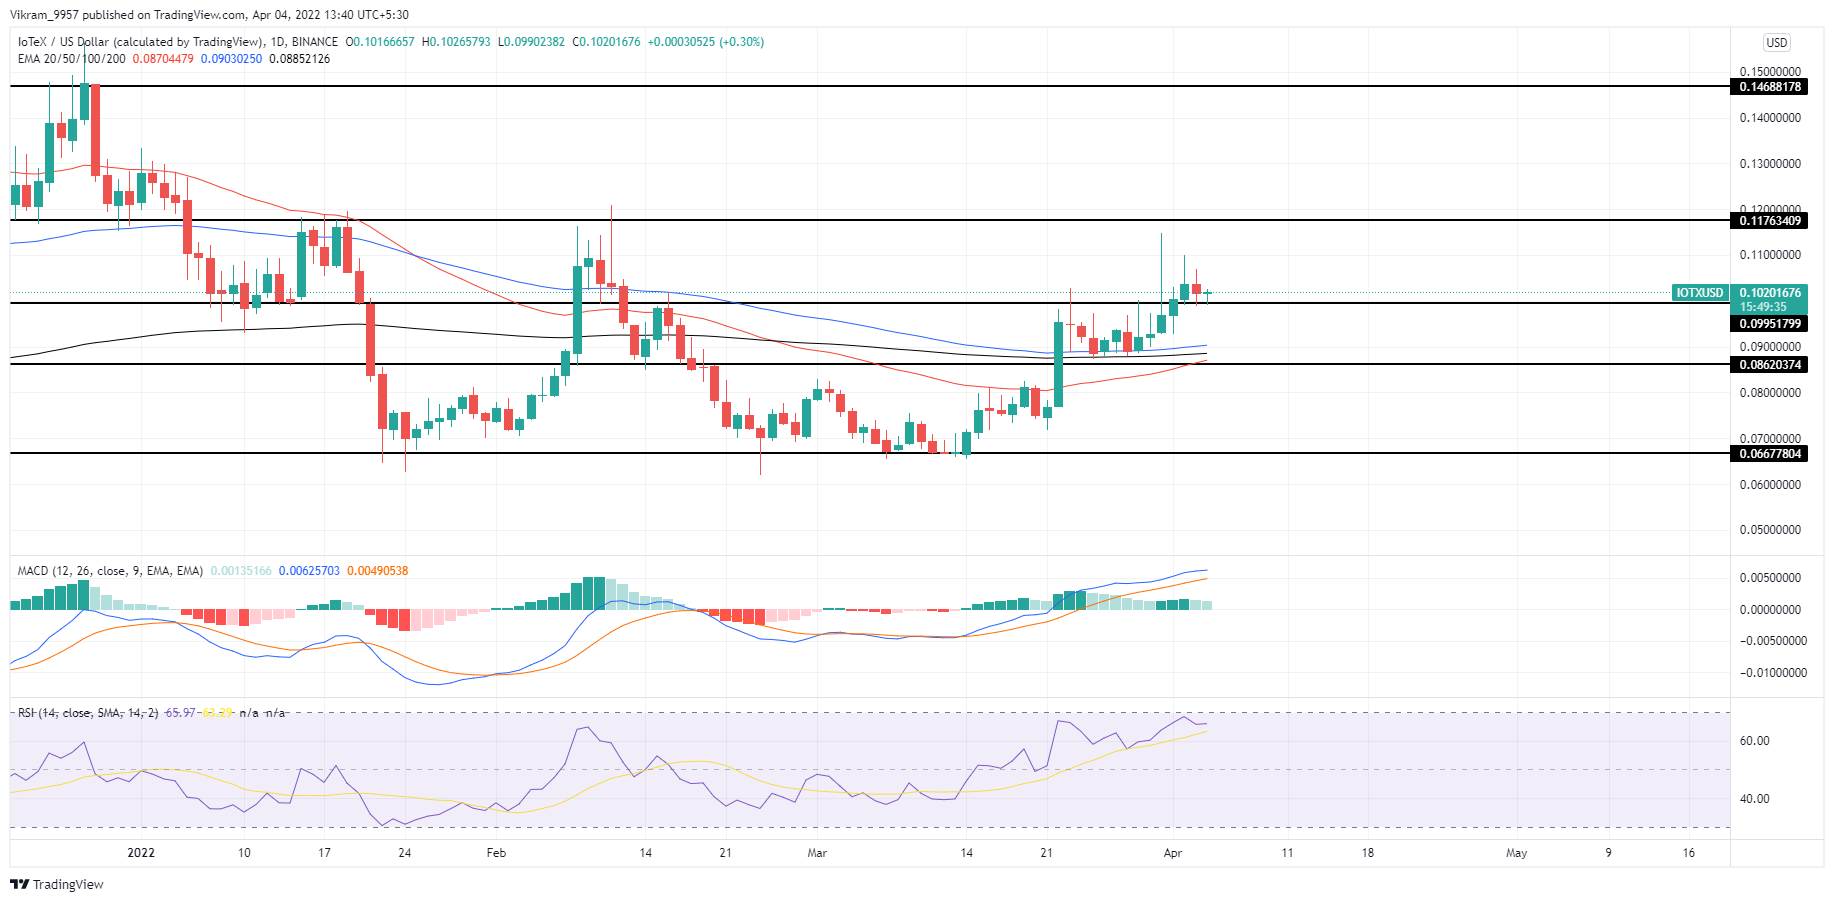
IOTX coin price retests the rounding bottom breakout and strives to sustain above the psychological stronghold at $0.10. Is this the right time to buy? Key technical points:
- IOTX prices have decreased by 1.10% in the past 24 hours.
- The IOTX/USD chart shows a high possibility of a golden crossover.
- Finally, the 24-hour trading volume of Iotex is $35.67 Million, marking a 68.58% fall.
Past Performance of IOTX
The IOTX coin price showcased a boom in buying pressure with a 25% office jump on March 22nd, resulting in a $0.085 breakout. The buying pressure decreased over the days and retested the bullish breakout. However, the bullish reversal from the 100-day EMA resulted in the rounding bottom pattern breakout and currently retests it for further bullish continuation.  Source-Tradingview
IOTX Technical Analysis
IOTX coin price action reflects higher price rejection but continues the higher low formation reflecting the solid underlying bullishness. Hence, the uptrend may approach the $0.11 mark shortly. The crucial daily EMAs (50, 100, and 200-days) maintain a slightly bearish alignment, but the increasing possibility of the golden crossover due to the 50-day EMA reversal may help regain the bullish status. Moreover, the price sustaining above the 100-day EMA stresses a buying possibility. RSI Indicator: The RSI slope sustains above the 14-day line, reflects the solid uptrend in action, and might shortly enter the overbought territory. MACD Indicator: The MACD and signal lines project an uptrend slowing down into a sideways trend. However, the histogram retains the bullish growth reflecting a solid underlying bullishness. The IOTX technical analysis reflects an elevated odds of an uptrend above the $0.10 mark.
Upcoming Trend
The IOTX coin price experiences growth in the buying pressure as it successfully retests the rounding bottom breakout. Moreover, the buyers undermine the selling observed above the $0.10 mark and continue to persist uptrend. Hence, traders can expert a target of $0.15 if buyers surpass the $0.11 horizontal level. Support Levels: $0.10 and $0.090 Resistance Levels: $0.11 and $0.15
 cryptoknowmics.com