40% per month. This is the result buyers were able to achieve during March 2022. If during the first half of the month there was still a struggle for a local reversal of the LINK price. Then in the second half of the month came the phase of successful implementation of this plan. However, the global situation on the LINK market has not changed. The price continues to move within the red wedge. the prospect of LINK price growth within this wedge is 15%. It is near the $20 mark that the fate of the next local price movement will be decided. In the last 3 trading weeks, the trading volumes during the LINK price growth is quite low. They are even a little lower usually. 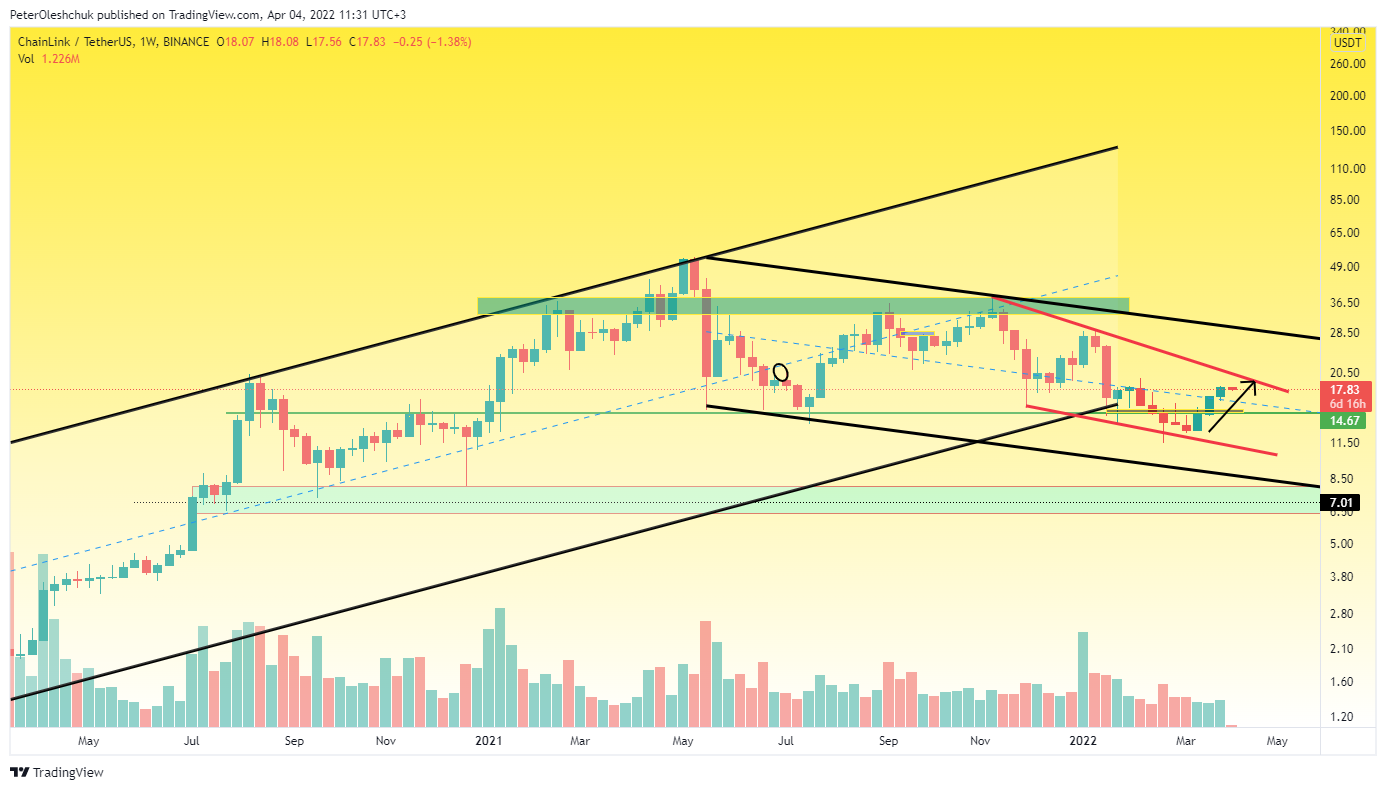 https://www.tradingview.com/x/oQkLenpZ/ So far, buyers do not show the potential to break the current red wedge up. Therefore, the final target for which buyers could expect $29 is still in question. The low interest of buyers to buy LINK at the current price suggests that the price has not reached an interesting range for large investors. In this case, the failed attempt of buyers to break the mark of $20 will end in a new fall wave with the first target of $11. But, if we see that aggression during the fall will grow in direct proportion to the trading volumes - then the final target of the LINK fall may well be around $8. In the weekly timeframe, we see that buyers kept the price well at this point during August-December 2021. Though, for such a negative scenario in the Bitcoin market, a new wave of decline with a target of at least $ 38,000 must begin.
Technical Analysis Of LINK On The Daily Timeframe
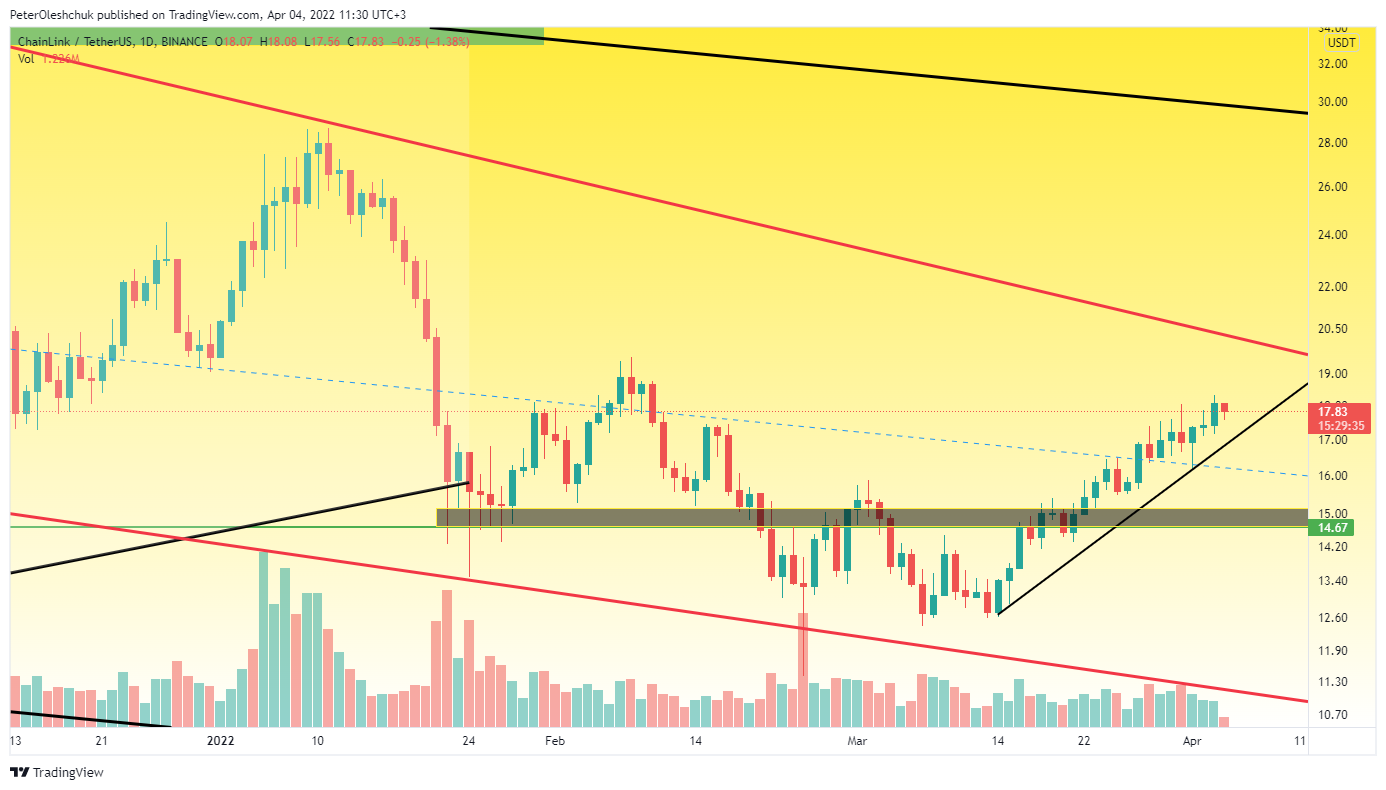 https://www.tradingview.com/x/Ou31GE4y/ Usually, such a lazy growth wave in small volumes ends in a sharp price reversal. The increase in the LINK price from 14 March can be completely covered by one daily candle. Such a fall can easily pass the distance of $14.6 in a day. The main condition for this scenario is that sellers take control of the $16.4 mark. If buyers are not able to organize resistance at this point, this scenario will be the main one for us. However, at the time of writing, buyers control both the $16.4 mark and the local trend line from 14 March. Therefore, the probability of continued lazy growth LINK to $20 - is still the main scenario. However, it should be understood that as soon as the price collides with the limited orders of buyers, a new fall wave will begin very sharply and unexpectedly.
LINKBTC Price Jumped From The Main Liquidity Range
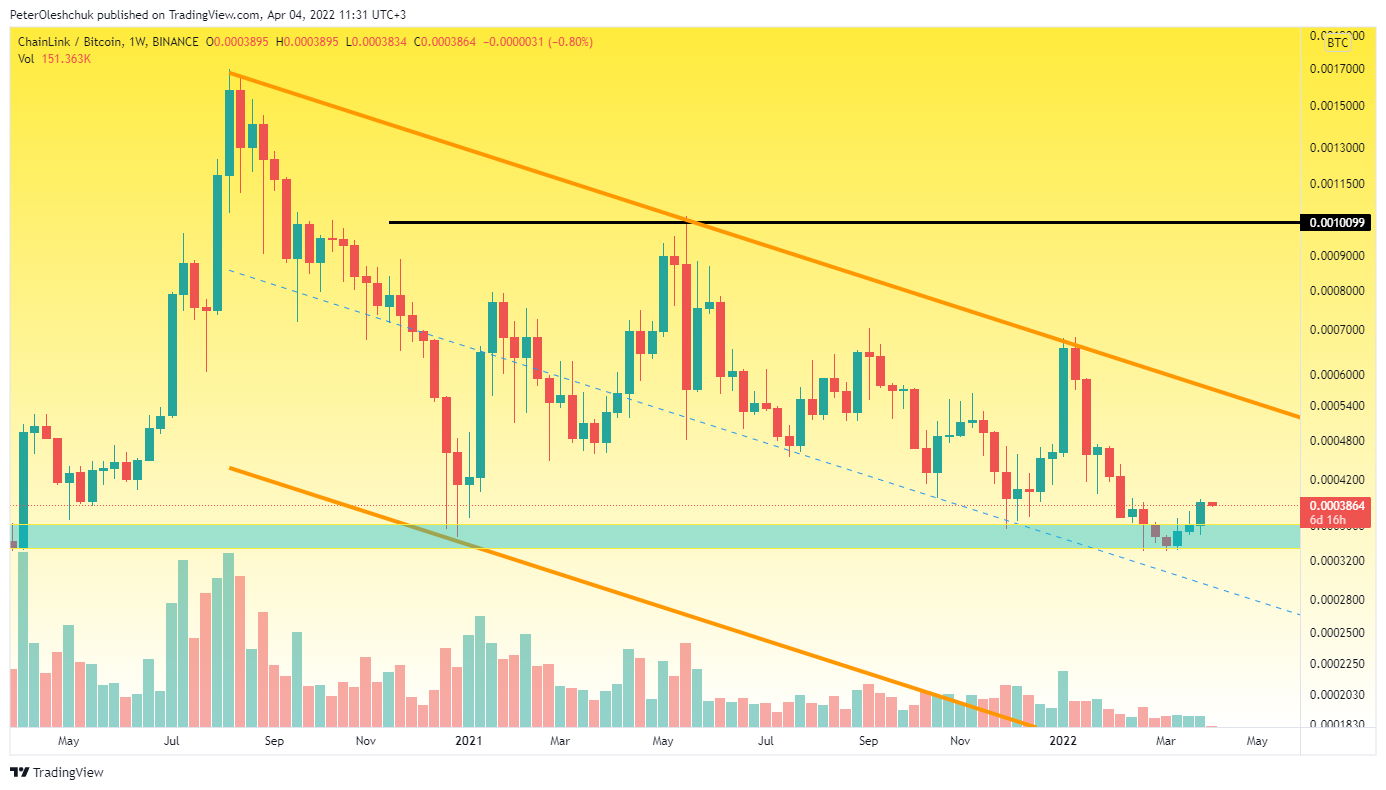 https://www.tradingview.com/x/MON2phLD/ Analyzing the movement of the LINK price on the weekly timeframe, we can see that the price stopped near the main liquidity level. The range of 0.00035 from March 2020 saves buyers from a total market crash. This is the 4th attack in this range in the previous two years. So far, buyers have been able to keep the range and launch a counterattack. However, as we can see, the rebound from the range of 0.00035 is quite passive. For the previous three weeks, the price barely deviated from this range and the trading volumes confirm the low interest. If we do not see an acceleration in the LINKBTC price during April, the probability of breaking this range down is quite high.