Bitcoin and Ethereum fell dramatically in the past 24 hours. Though prices have returned to pre-crash levels, multiple technical indicators suggest the worst is yet to come.
Mt. Gox Still Haunts Bitcoin
Bitcoin took a 6% nosedive in the last 24 hours that saw its price drop below the $18,000 mark for the first time in over a week.
The pioneer cryptocurrency was able to rebound significantly, regaining the $18,300 level as support. Although the recent bullish impulse looks promising, several indicators suggest that BTC will continue to fall.
One reason behind the bearish tumble is Mt. Gox exchange’s upcoming distribution of nearly 140,000 BTC to victims of the platform’s shutdown in 2014. Due to Bitcoin’s price appreciation since then, it is reasonable to assume that many recipients will sell their newly-received tokens on the open market.
A $3 billion injection of Bitcoin could be the catalyst that ignites the next major correction.
When considering that some of the so-called “whales” have been offloading their coins since Nov. 18, the potential spike in selling pressure may have the strength to push prices lower.
Santiment’s holder distribution chart shows that the number of addresses holding 10,000 to 100,000 BTC has dropped significantly. Roughly seven whales have left the network or redistributed their tokens, representing a 2.7% drop over a short period.
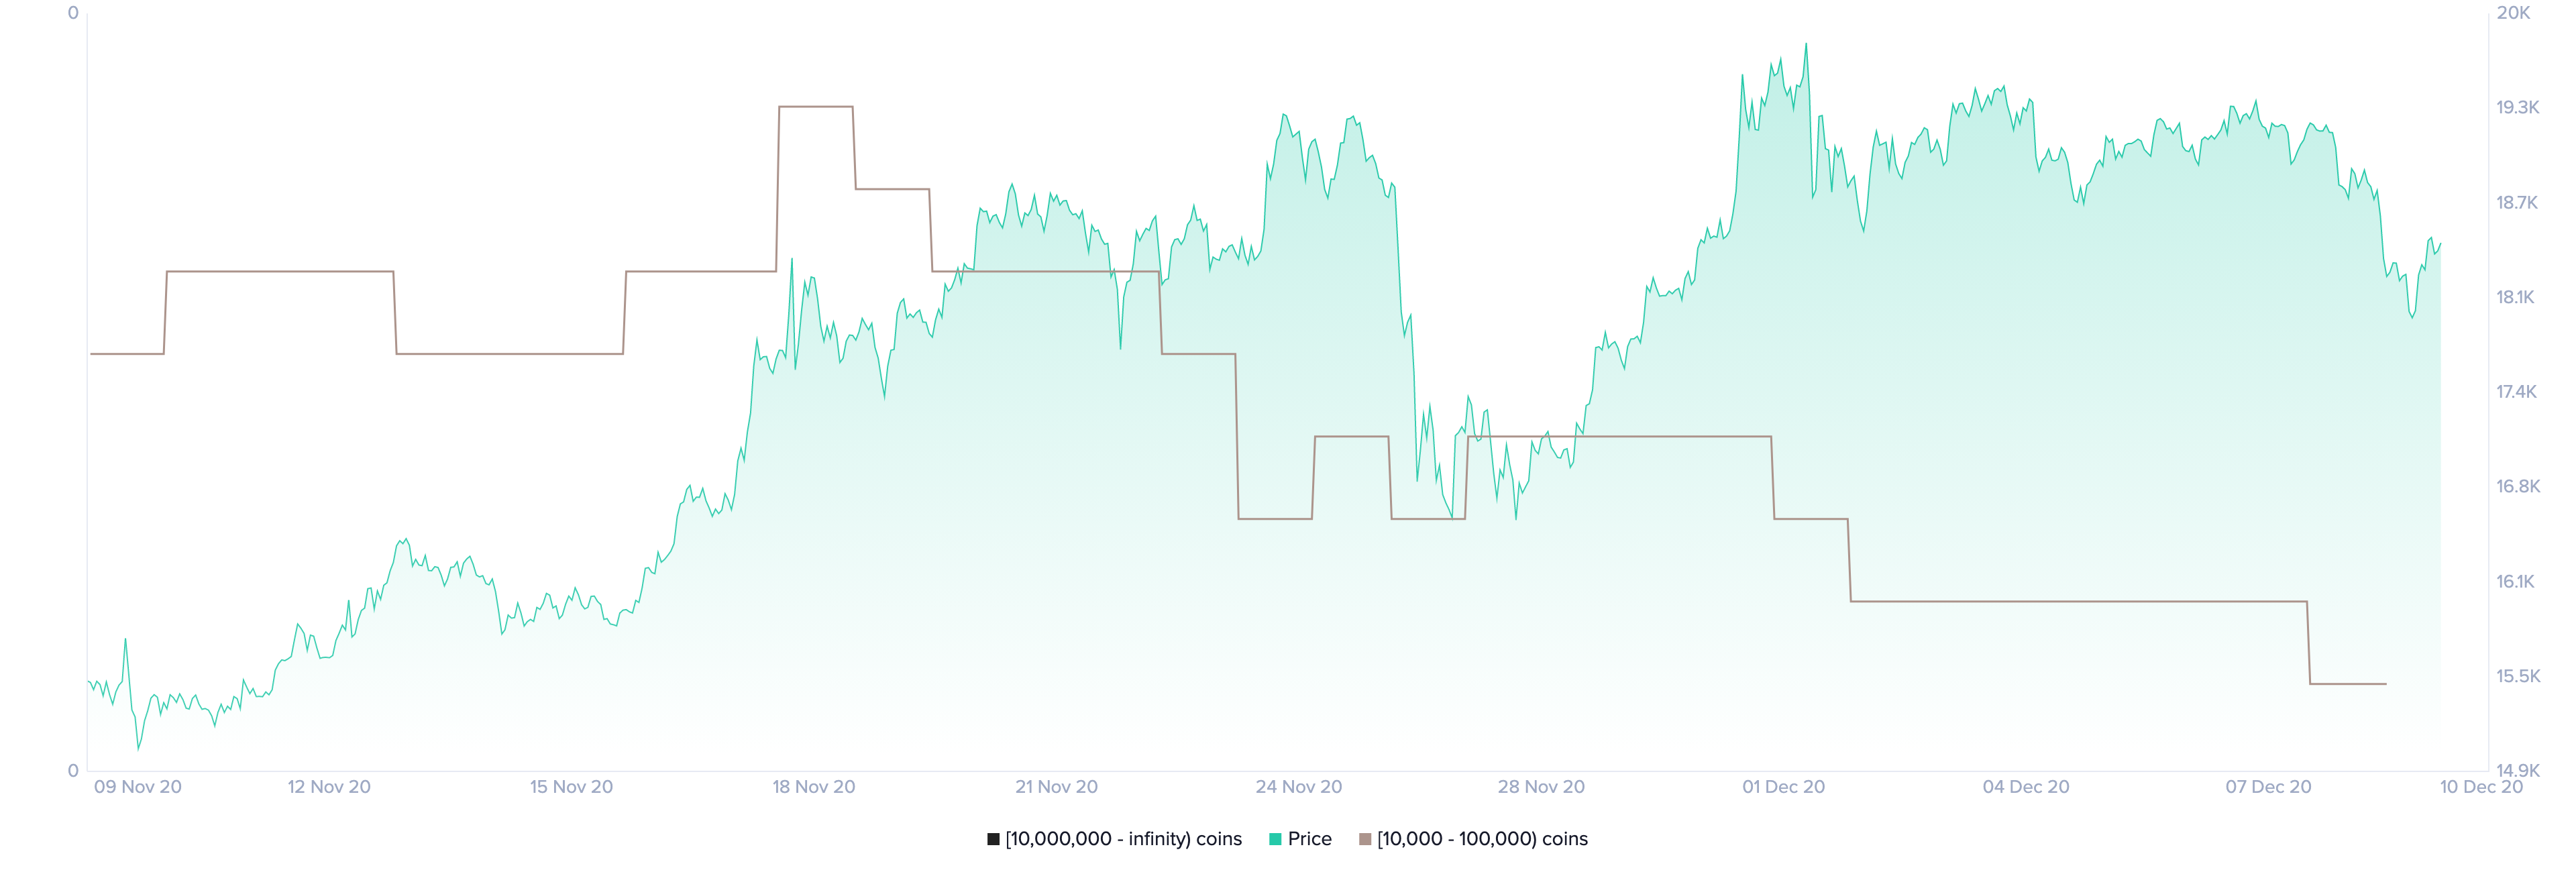
The decreasing number of Bitcoin whales on the network may seem insignificant at first glance. However, these large investors hold between $183 million and $1.83 billion in BTC. Thus, the downward pressure from these users is significant.
If the selling spree continues, Bitcoin might be bound for a steep retracement.
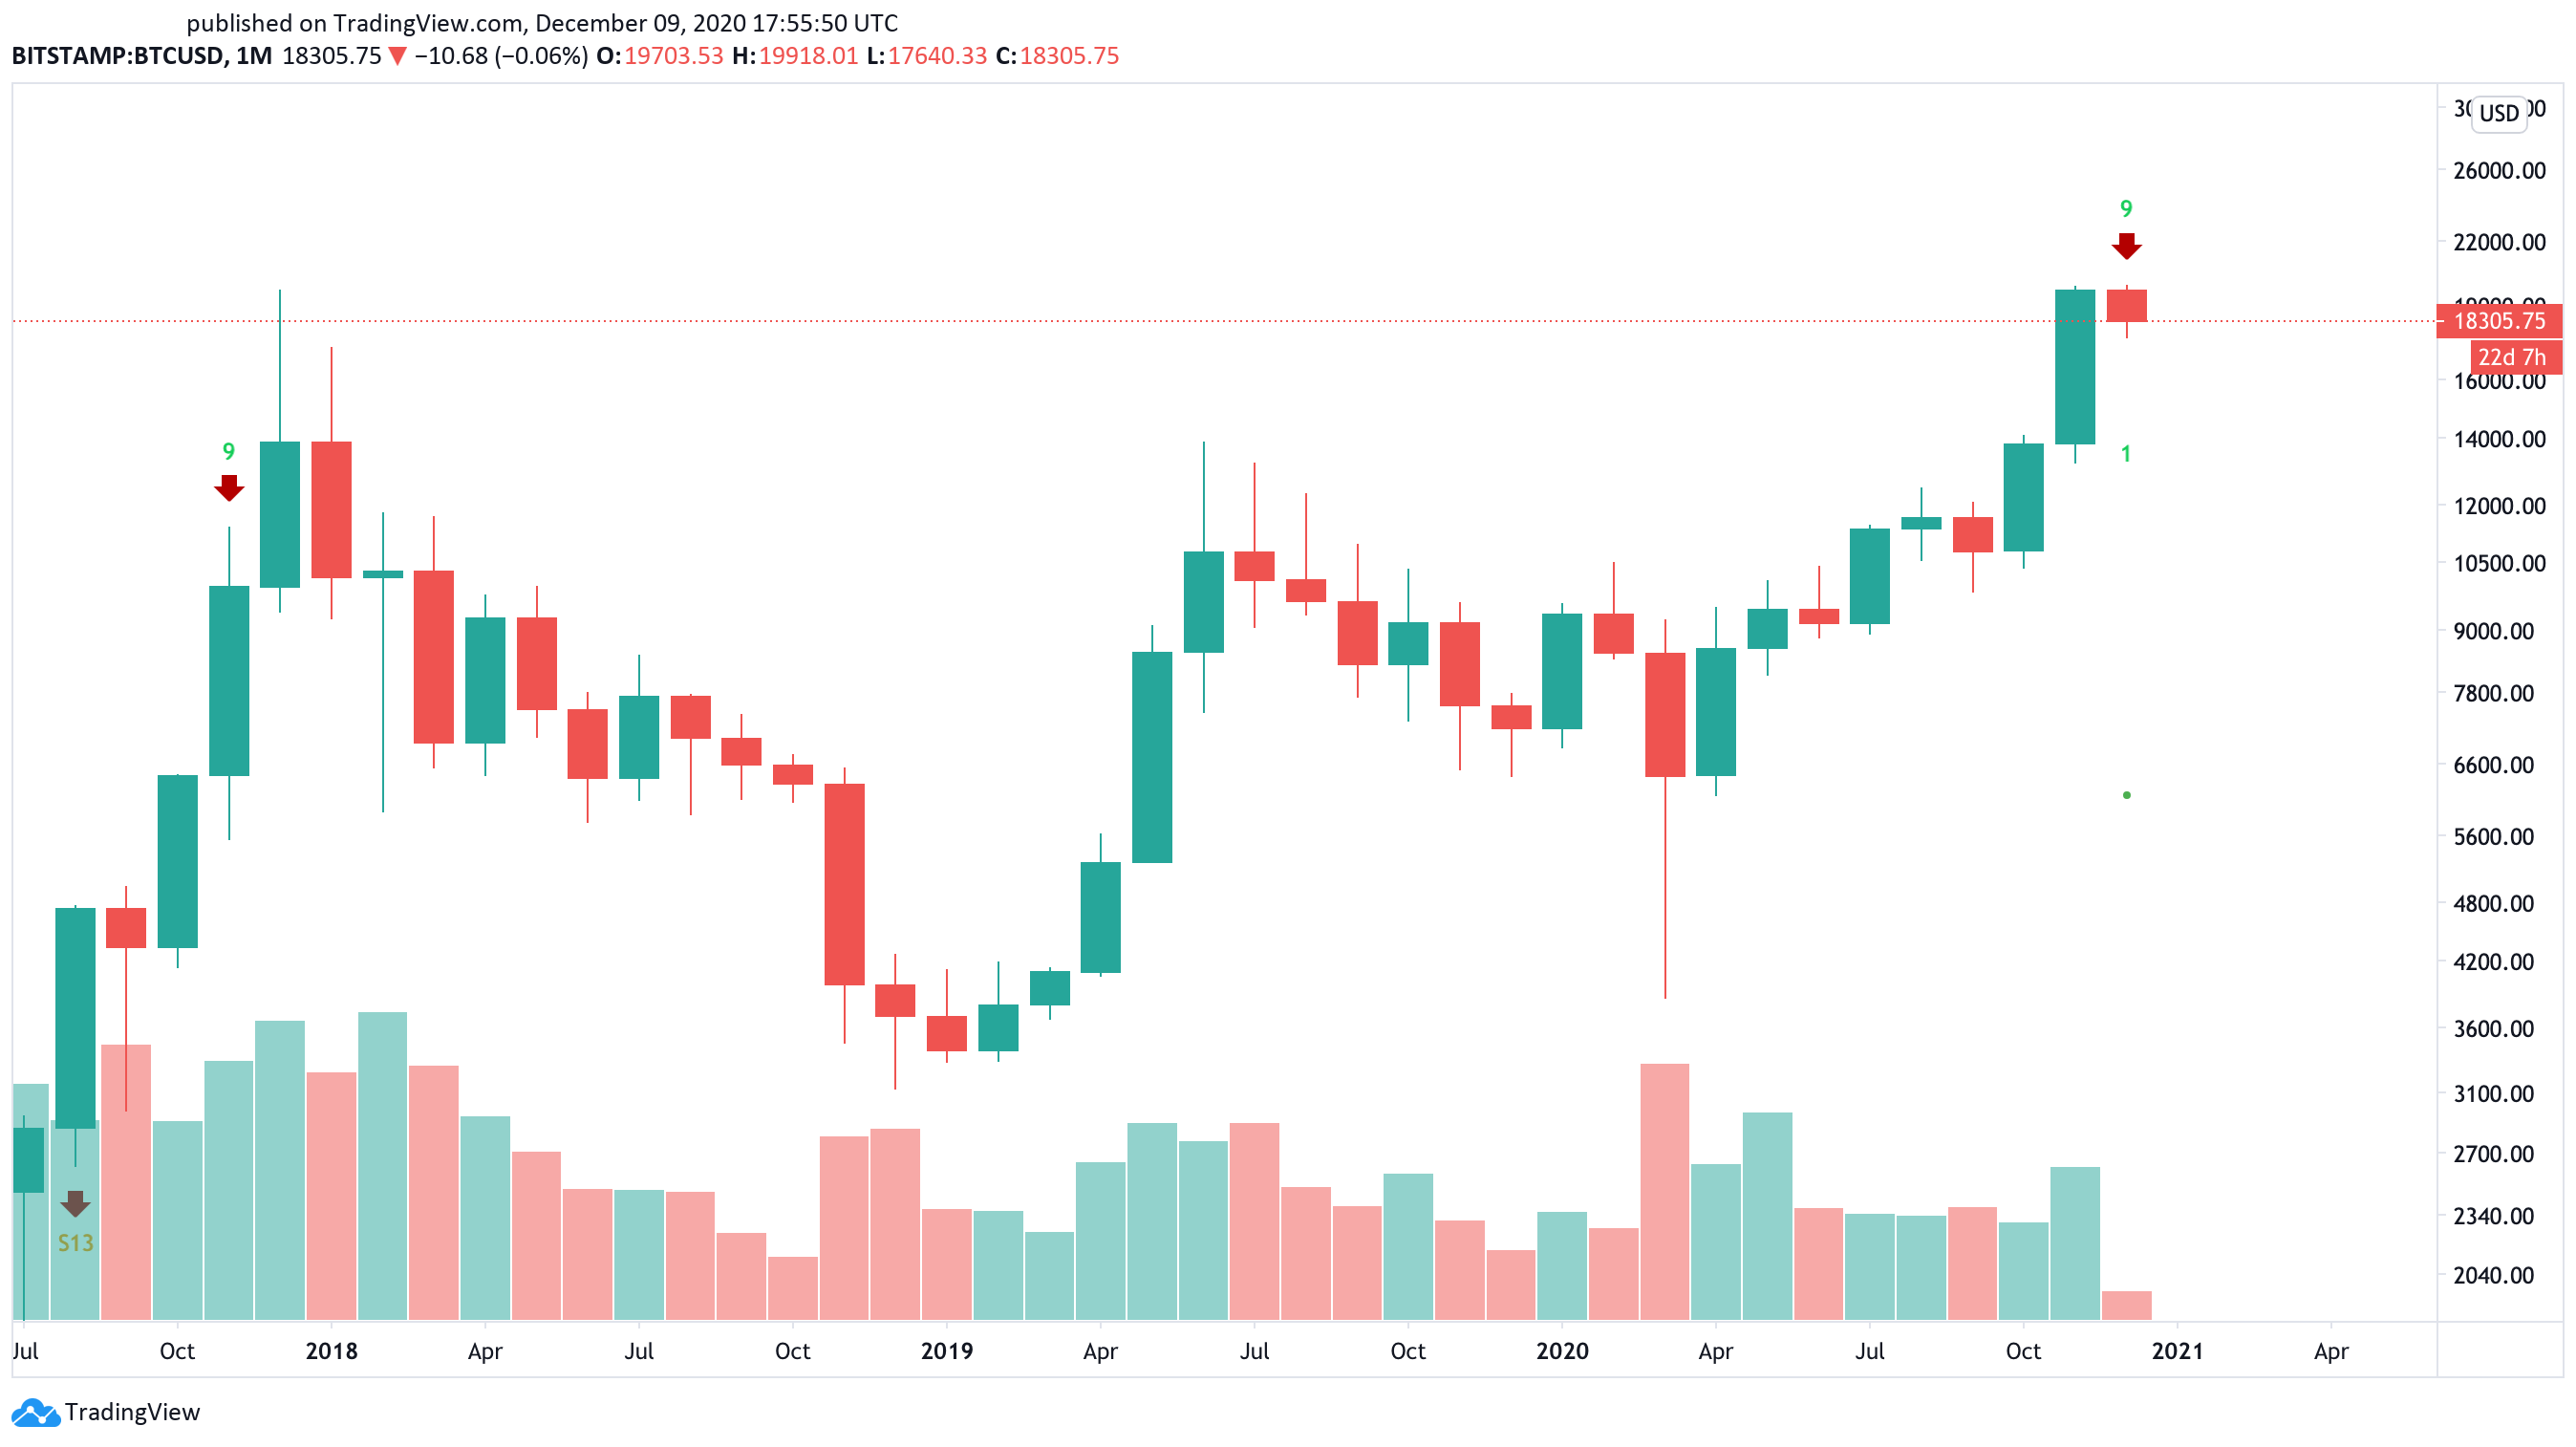
The TD sequential indicator adds credence to the pessimistic outlook. This technical index recently presented a sell signal in the form of a green nine candlestick on BTC’s 1-month chart. The bearish formation forecasts a one to four monthly candlesticks pullback before the uptrend resumes.
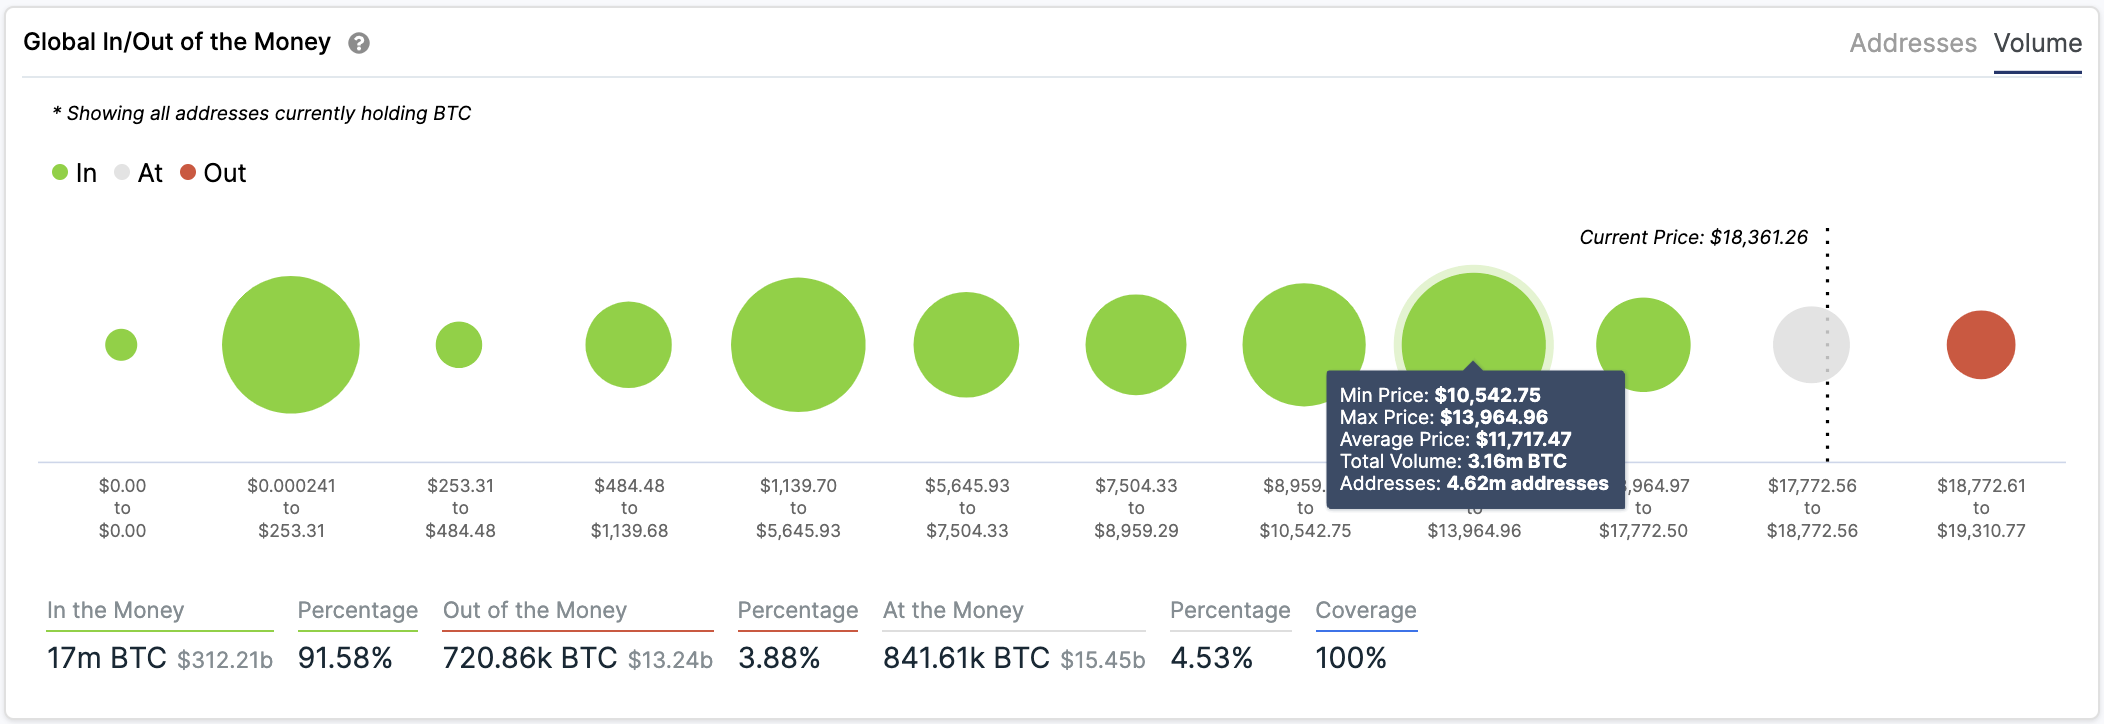
On its way down, IntoTheBlock’s “Global In/Out of the Money” (GIOM) model shows that the strongest support level underneath Bitcoin lies between $10,500 and $13,740. Here, roughly 4.6 million addresses had previously purchased more than 3 million BTC.
This massive demand wall could serve as stiff support in a correction, keeping falling prices at bay.
It is worth noting that institutional demand for Bitcoin continues rising. Microstrategy has announced $400 million in senior convertible notes to raise capital for purchasing even more Bitcoin. Therefore, the bullish outlook cannot be taken out of the question yet.
A daily candlestick close above the recent all-time high of $19,915 would also jeopardize the pessimistic scenario. If this were to happen, Bitcoin could shoot up to $24,000 or even $56,000, as suggested by trading veteran Peter Brandt.
Ethereum Network Participation Drops 70%
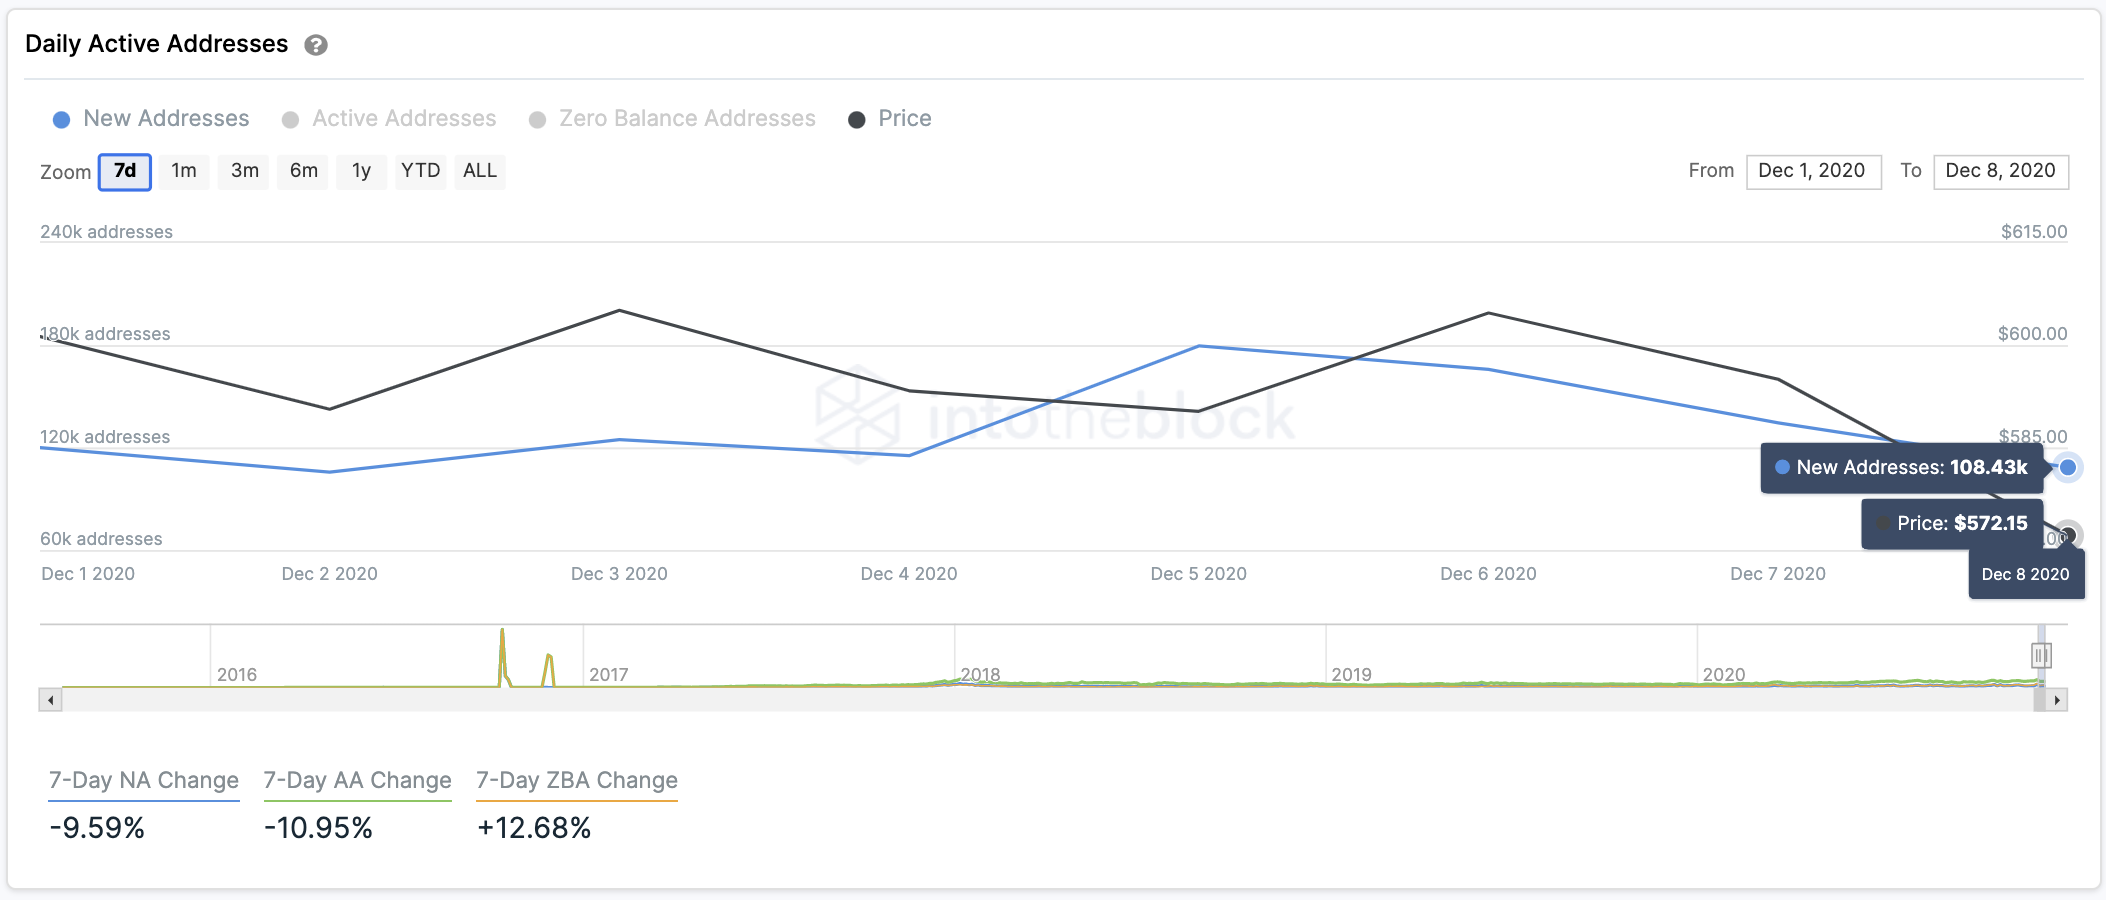
Though users have staked almost 1.3 million ETH in preparation for Ethereum 2.0, there has been a substantial decline in the number of new daily addresses created in the past few days.
Roughly 180,000 addresses were joining the network on Dec. 5. This number has plummeted to 108,000 a day, representing more than a 70% drop.
The downward trend in network growth is a red flag for near-term price growth.
Usually, a sustained decline in network growth is a leading indicator of deteriorating prices. The lack of newly-created addresses tends to affect the regular inflow and outflow of tokens in the network, and hence liquidity.
When looking at the TD sequential indicator, this thesis holds.
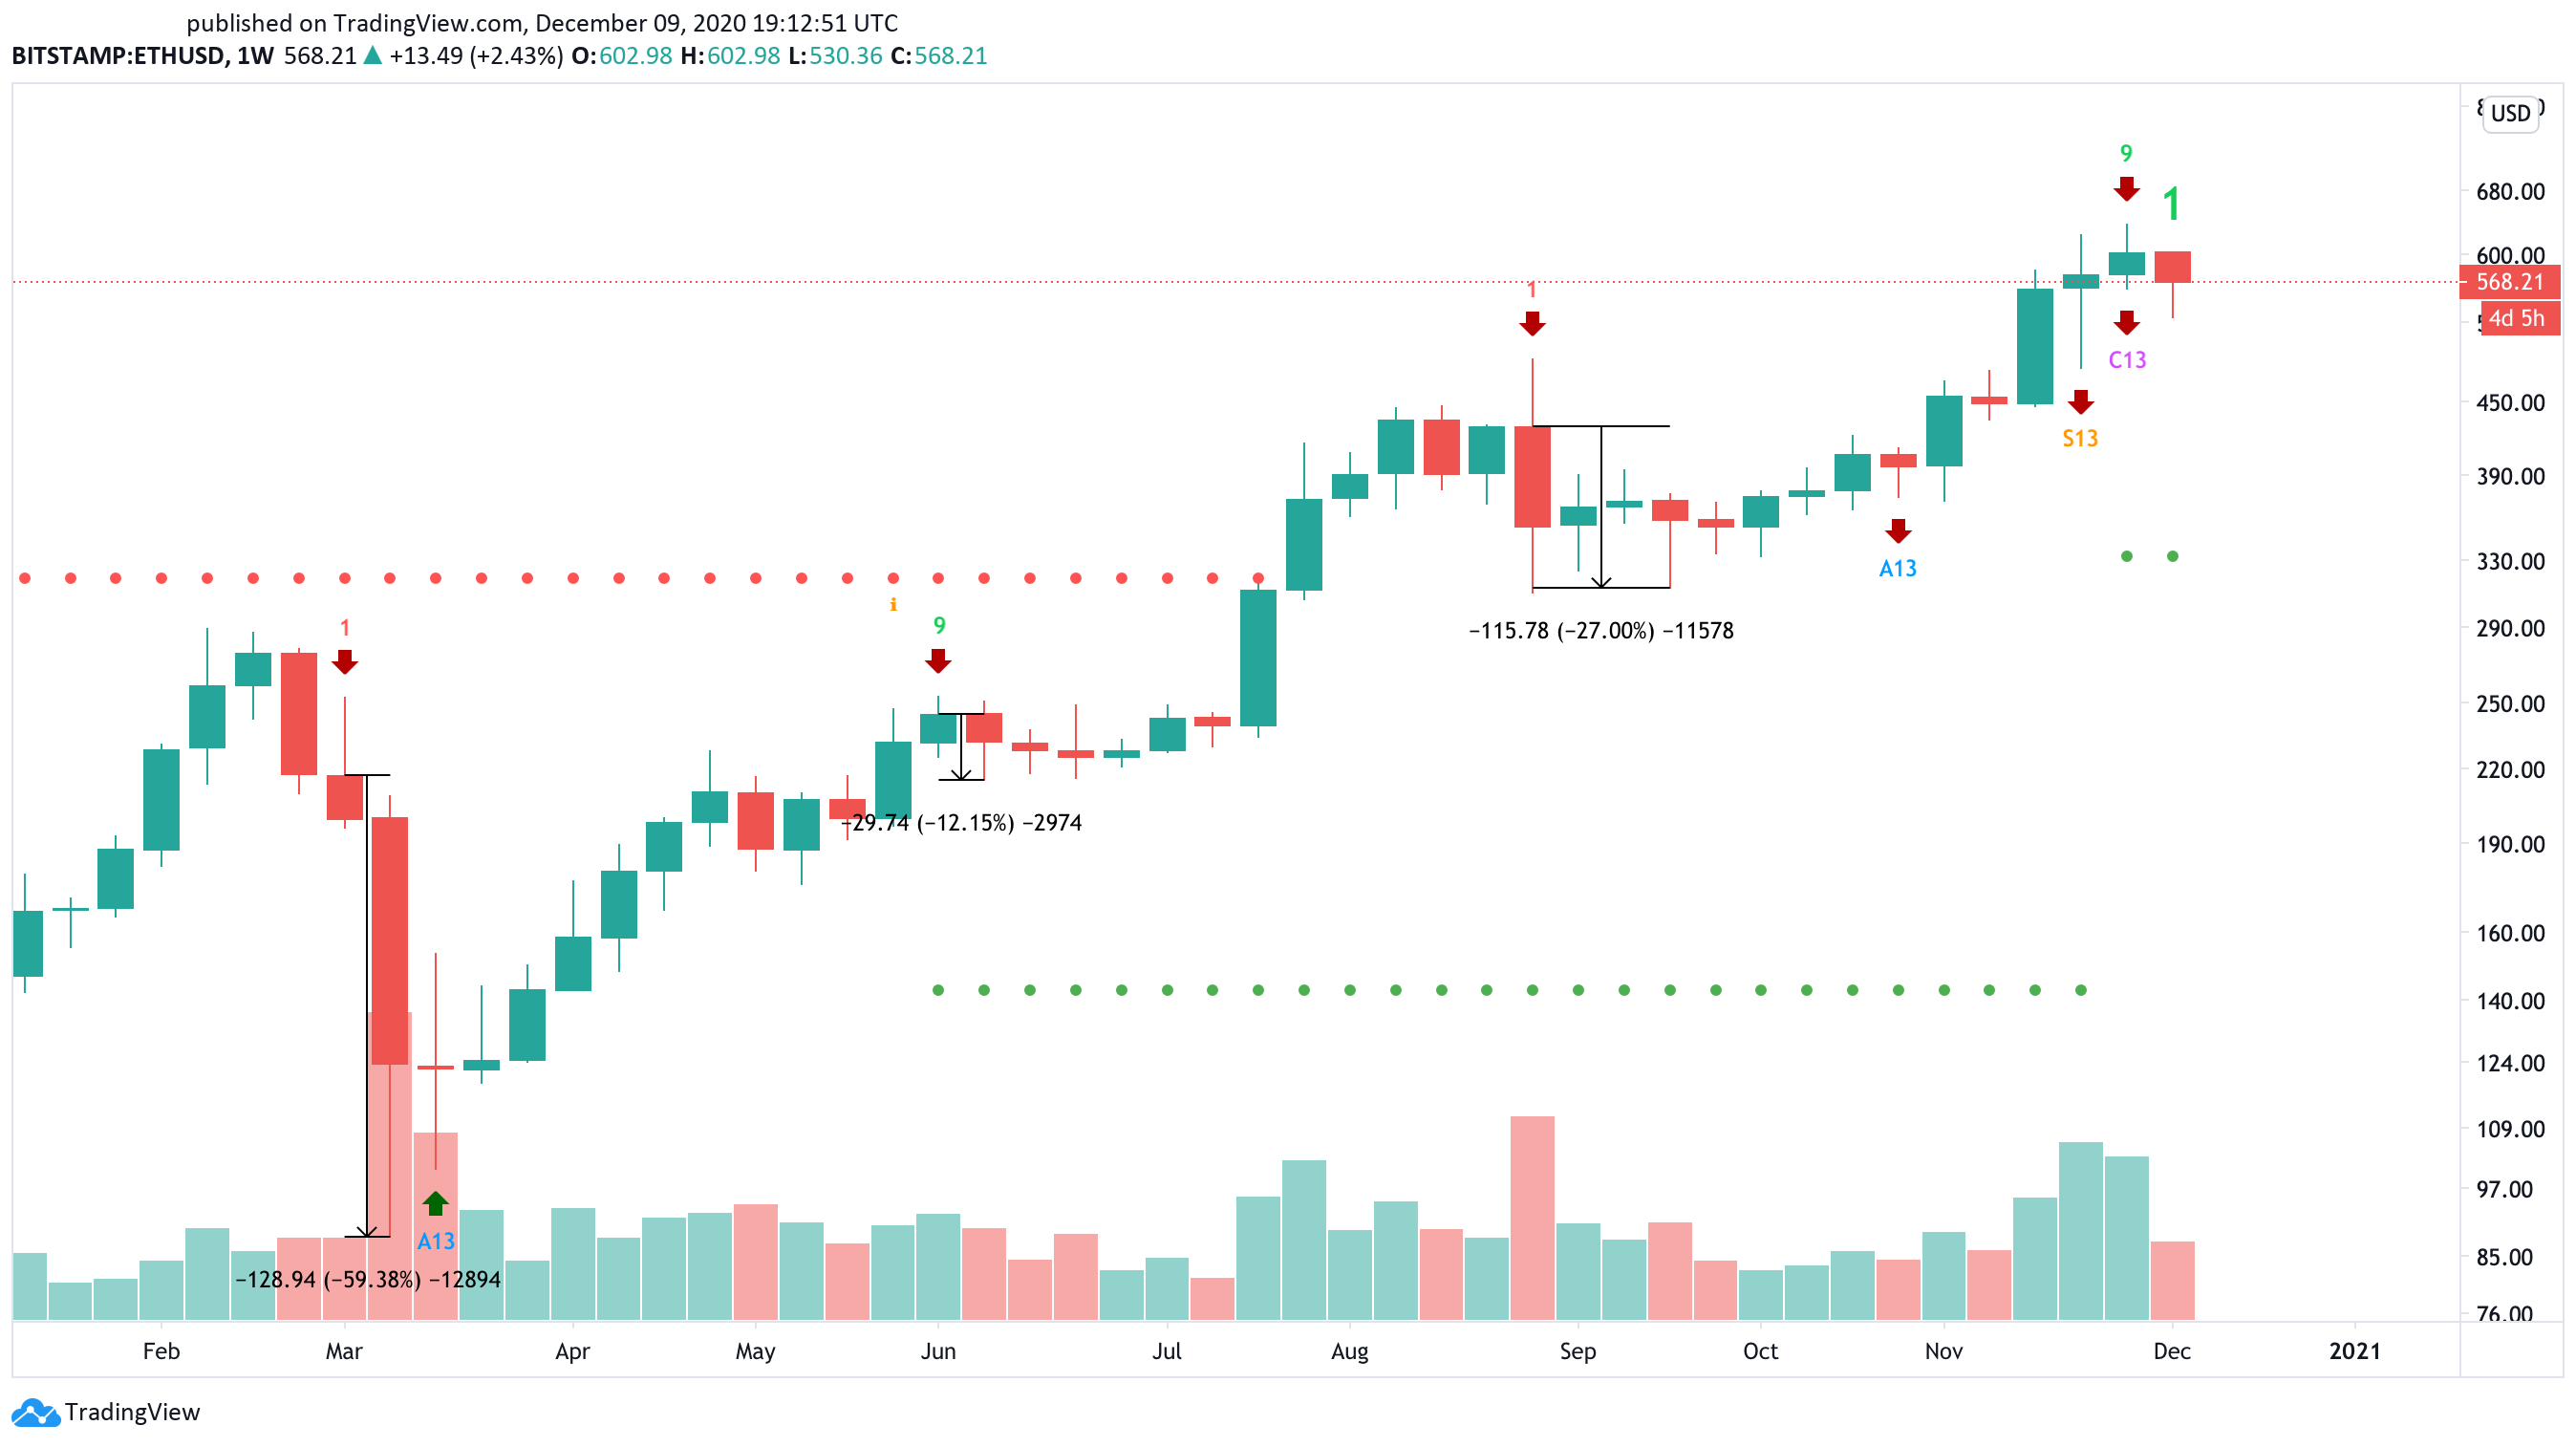
This technical index presented a sell signal in the form of green nine candlesticks on Ether’s 1-week chart. The bearish formation suggests that a spike in sell orders around the current price levels may lead to a steep decline that lasts up to four weekly candlesticks.
A glimpse at Ethereum’s weekly chart reveals that the TD setup has been incredibly accurate at anticipating local tops. The last three sell signals provided by this indicator were all validated, resulting in considerable corrections.
By measuring the Fibonacci retracement index from mid-March’s low of $88 to the recent high of $637, multiple targets can be defined. Based on this technical indicator, a spike in sell orders around the current price levels could push Ether to $430.
But if the selling pressure is strong enough, prices may fall towards the next critical area of support, around $360.
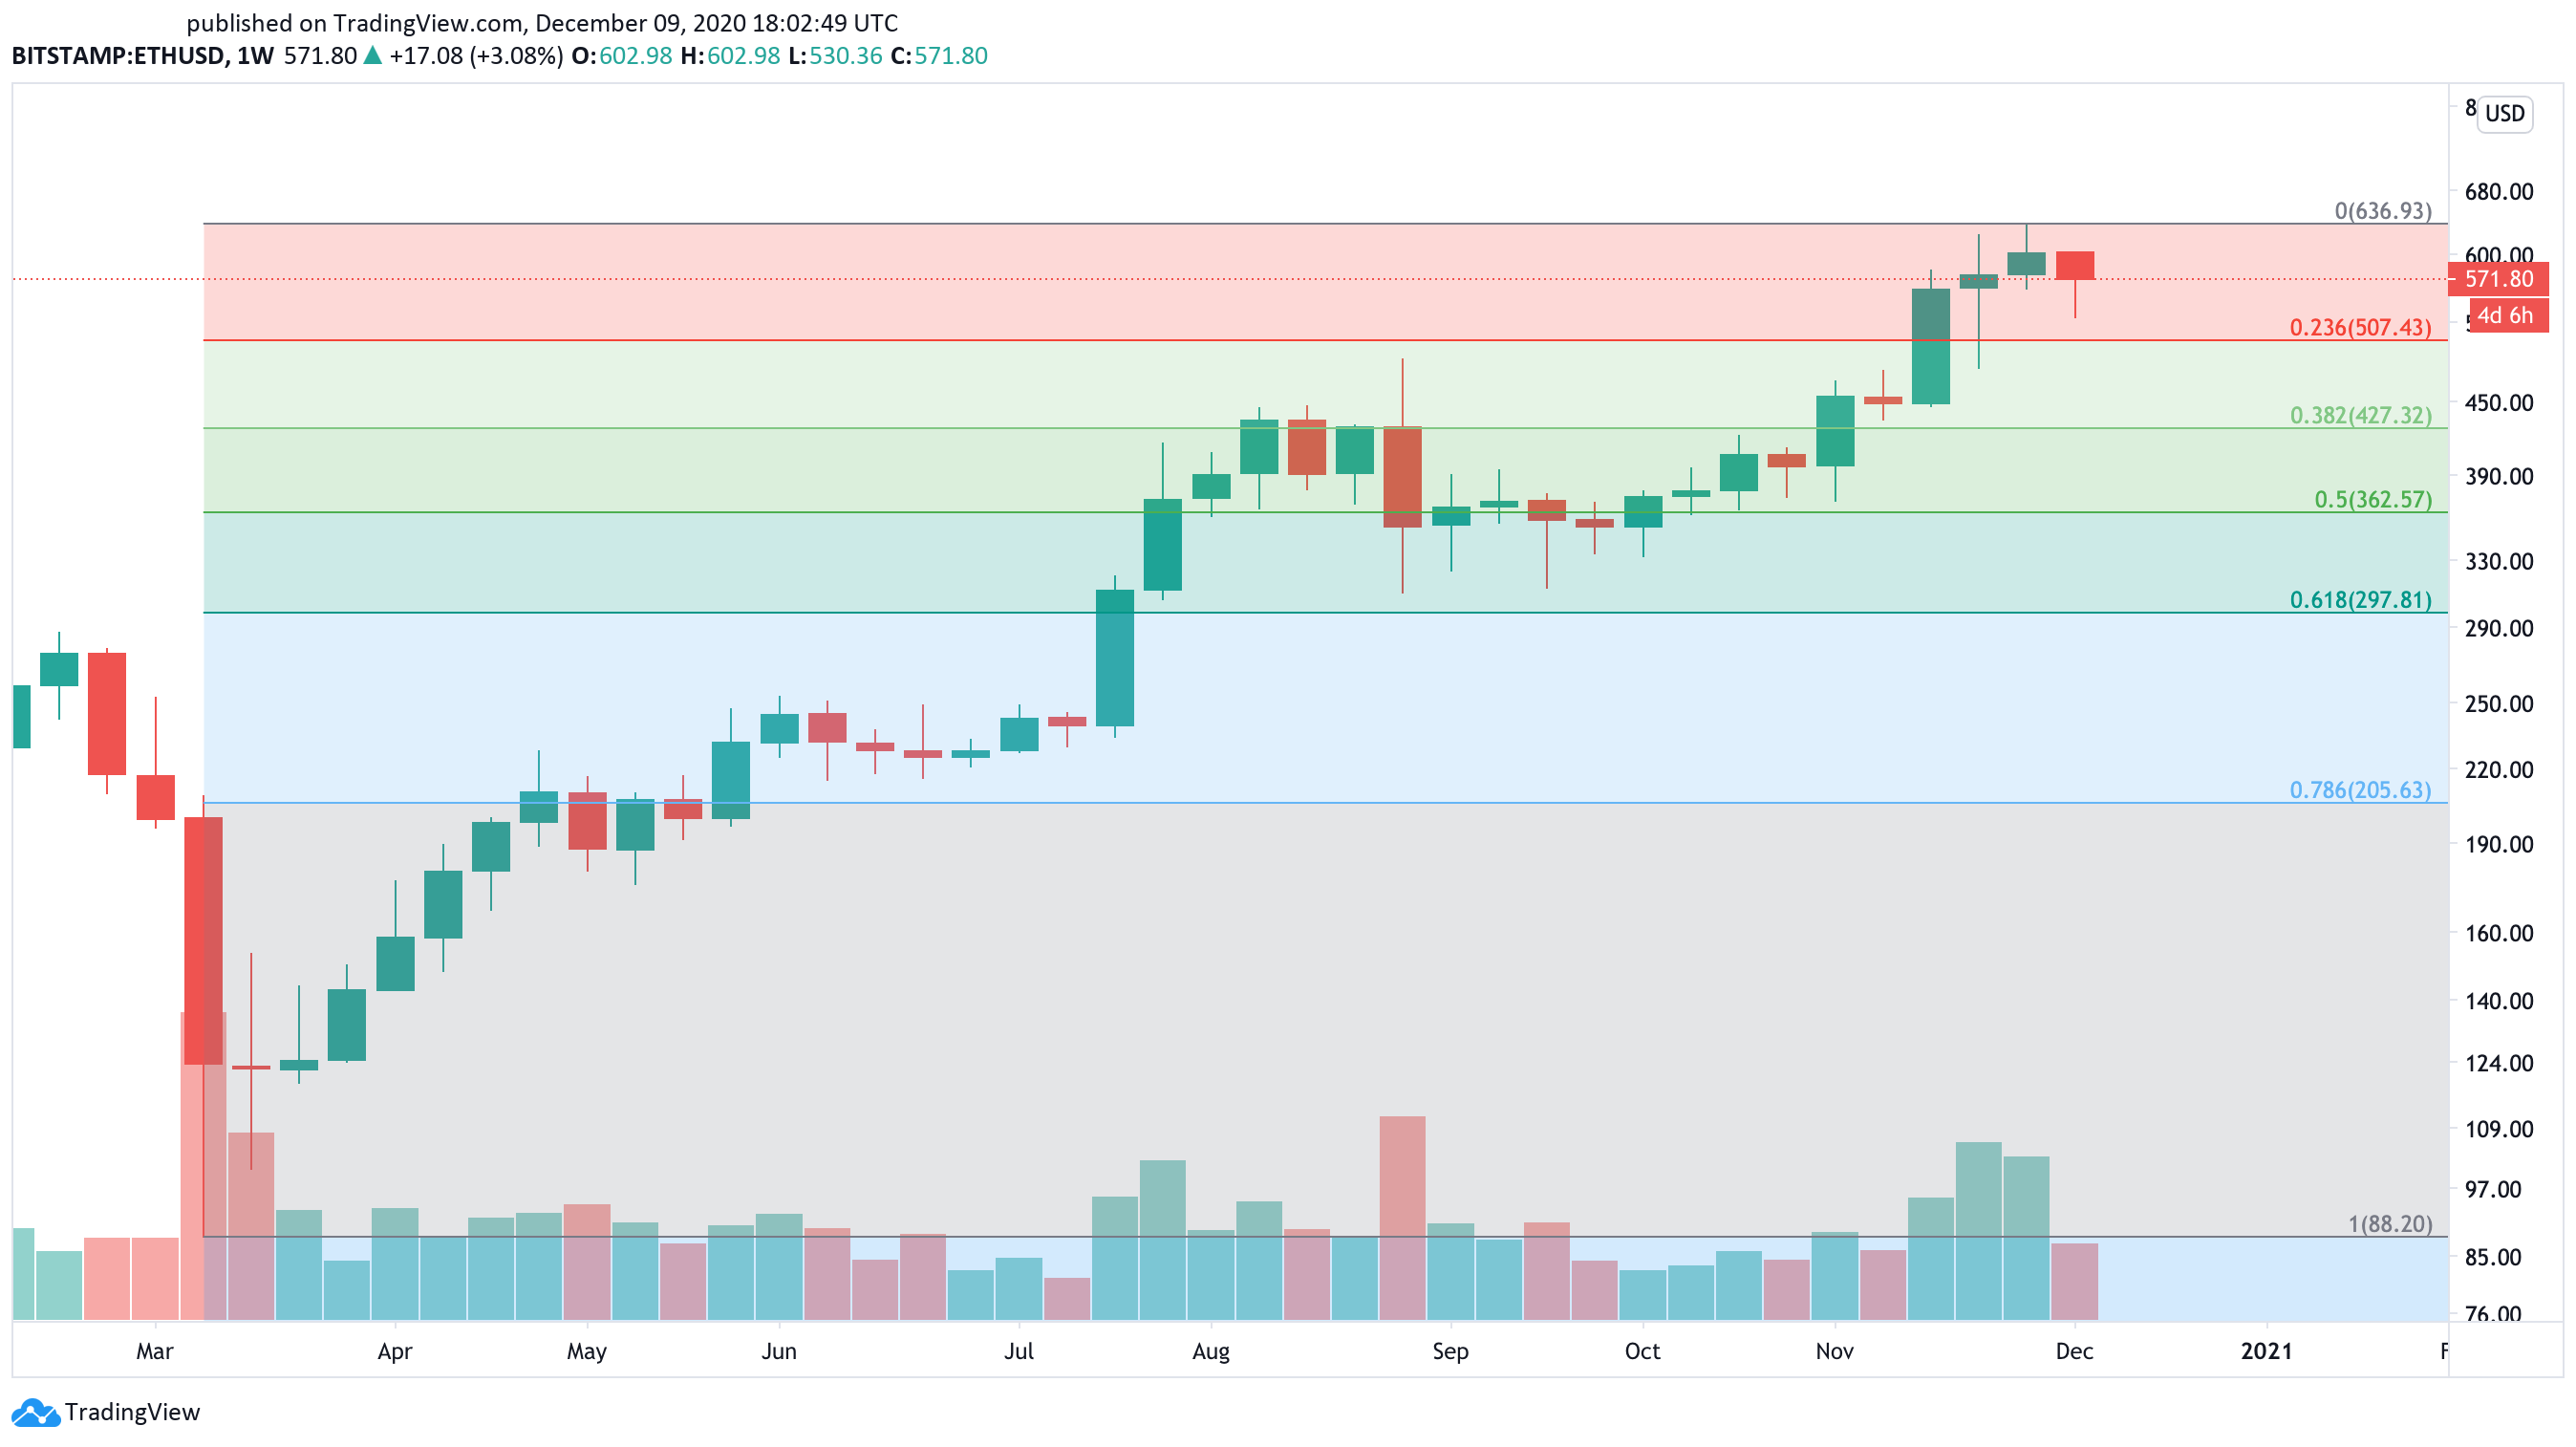
Though indicators suggest that Ethereum is poised for further losses, the $367 resistance must hold.
Failing to do so will likely ignite a state of FOMO among market participants as ETH could rise to $800.
The Cryptocurrency Market Moves Forward
The backdrop to Bitcoin’s performance has been strong fundamentals pushing institutional investors to leave gold behind. Although hedging against central banks’ money printers seems to be one of the main factors driving demand for this new asset class, businesses and entire countries are using BTC in international trade.
Put otherwise, “the price of gold would suffer from a structural flow headwind over the coming years,” while the pioneer cryptocurrency takes the spotlight, according to JP Morgan.
Ethereum is also benefitting from the clout given its upcoming upgrade. While investors begin to earn passive income by staking their tokens, CFTC chairman Heath Tarbert went as far as to say that he was “impressed” by the utility of this blockchain.
Both Bitcoin and Ethereum seem to have a bright future ahead, but in the near-term, a correction may take place. Such market behavior will help maintain a healthy uptrend as sidelined investors will have the opportunity to re-enter the market, fueling further appreciation.
Disclosure: At time of writing, this author owned Bitcoin and Ethereum.