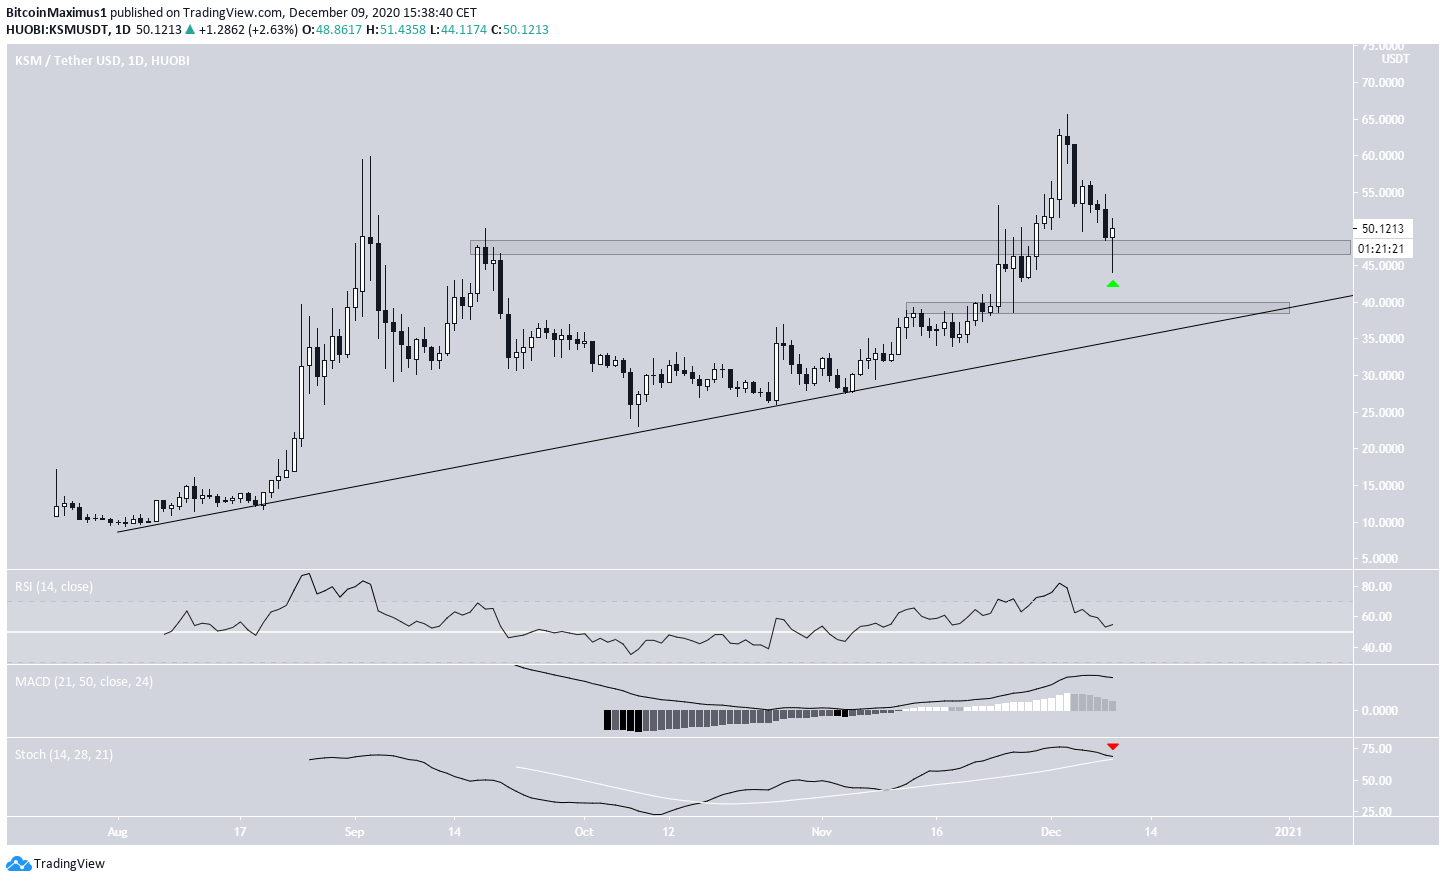
The Kusama (KSM) price is currently in the process of validating an important resistance area as support.
KSM is likely to hold this level and eventually make another attempt at breaking the yearly highs.
KSM Bounces at Support
KSM has been following an ascending support line since the beginning of August. The upward move culminated in a high of $65.56, which it reached on Dec. 3. KSM has been moving downwards since.
Currently, it is trading just above the $47.50 area and is in the process of creating a bullish hammer (shown with the green arrow below). If this holds, it would be a resistance/support flip, validating the $47.50 area as support.
Nevertheless, technical indicators are neutral. While the RSI is above 50 and the MACD is above 0, both are falling. The Stochastic Oscillator is very close to making a bearish cross.
If KSM were to break down, the next closest support area would be at $3.90, also coinciding with the ascending support line.
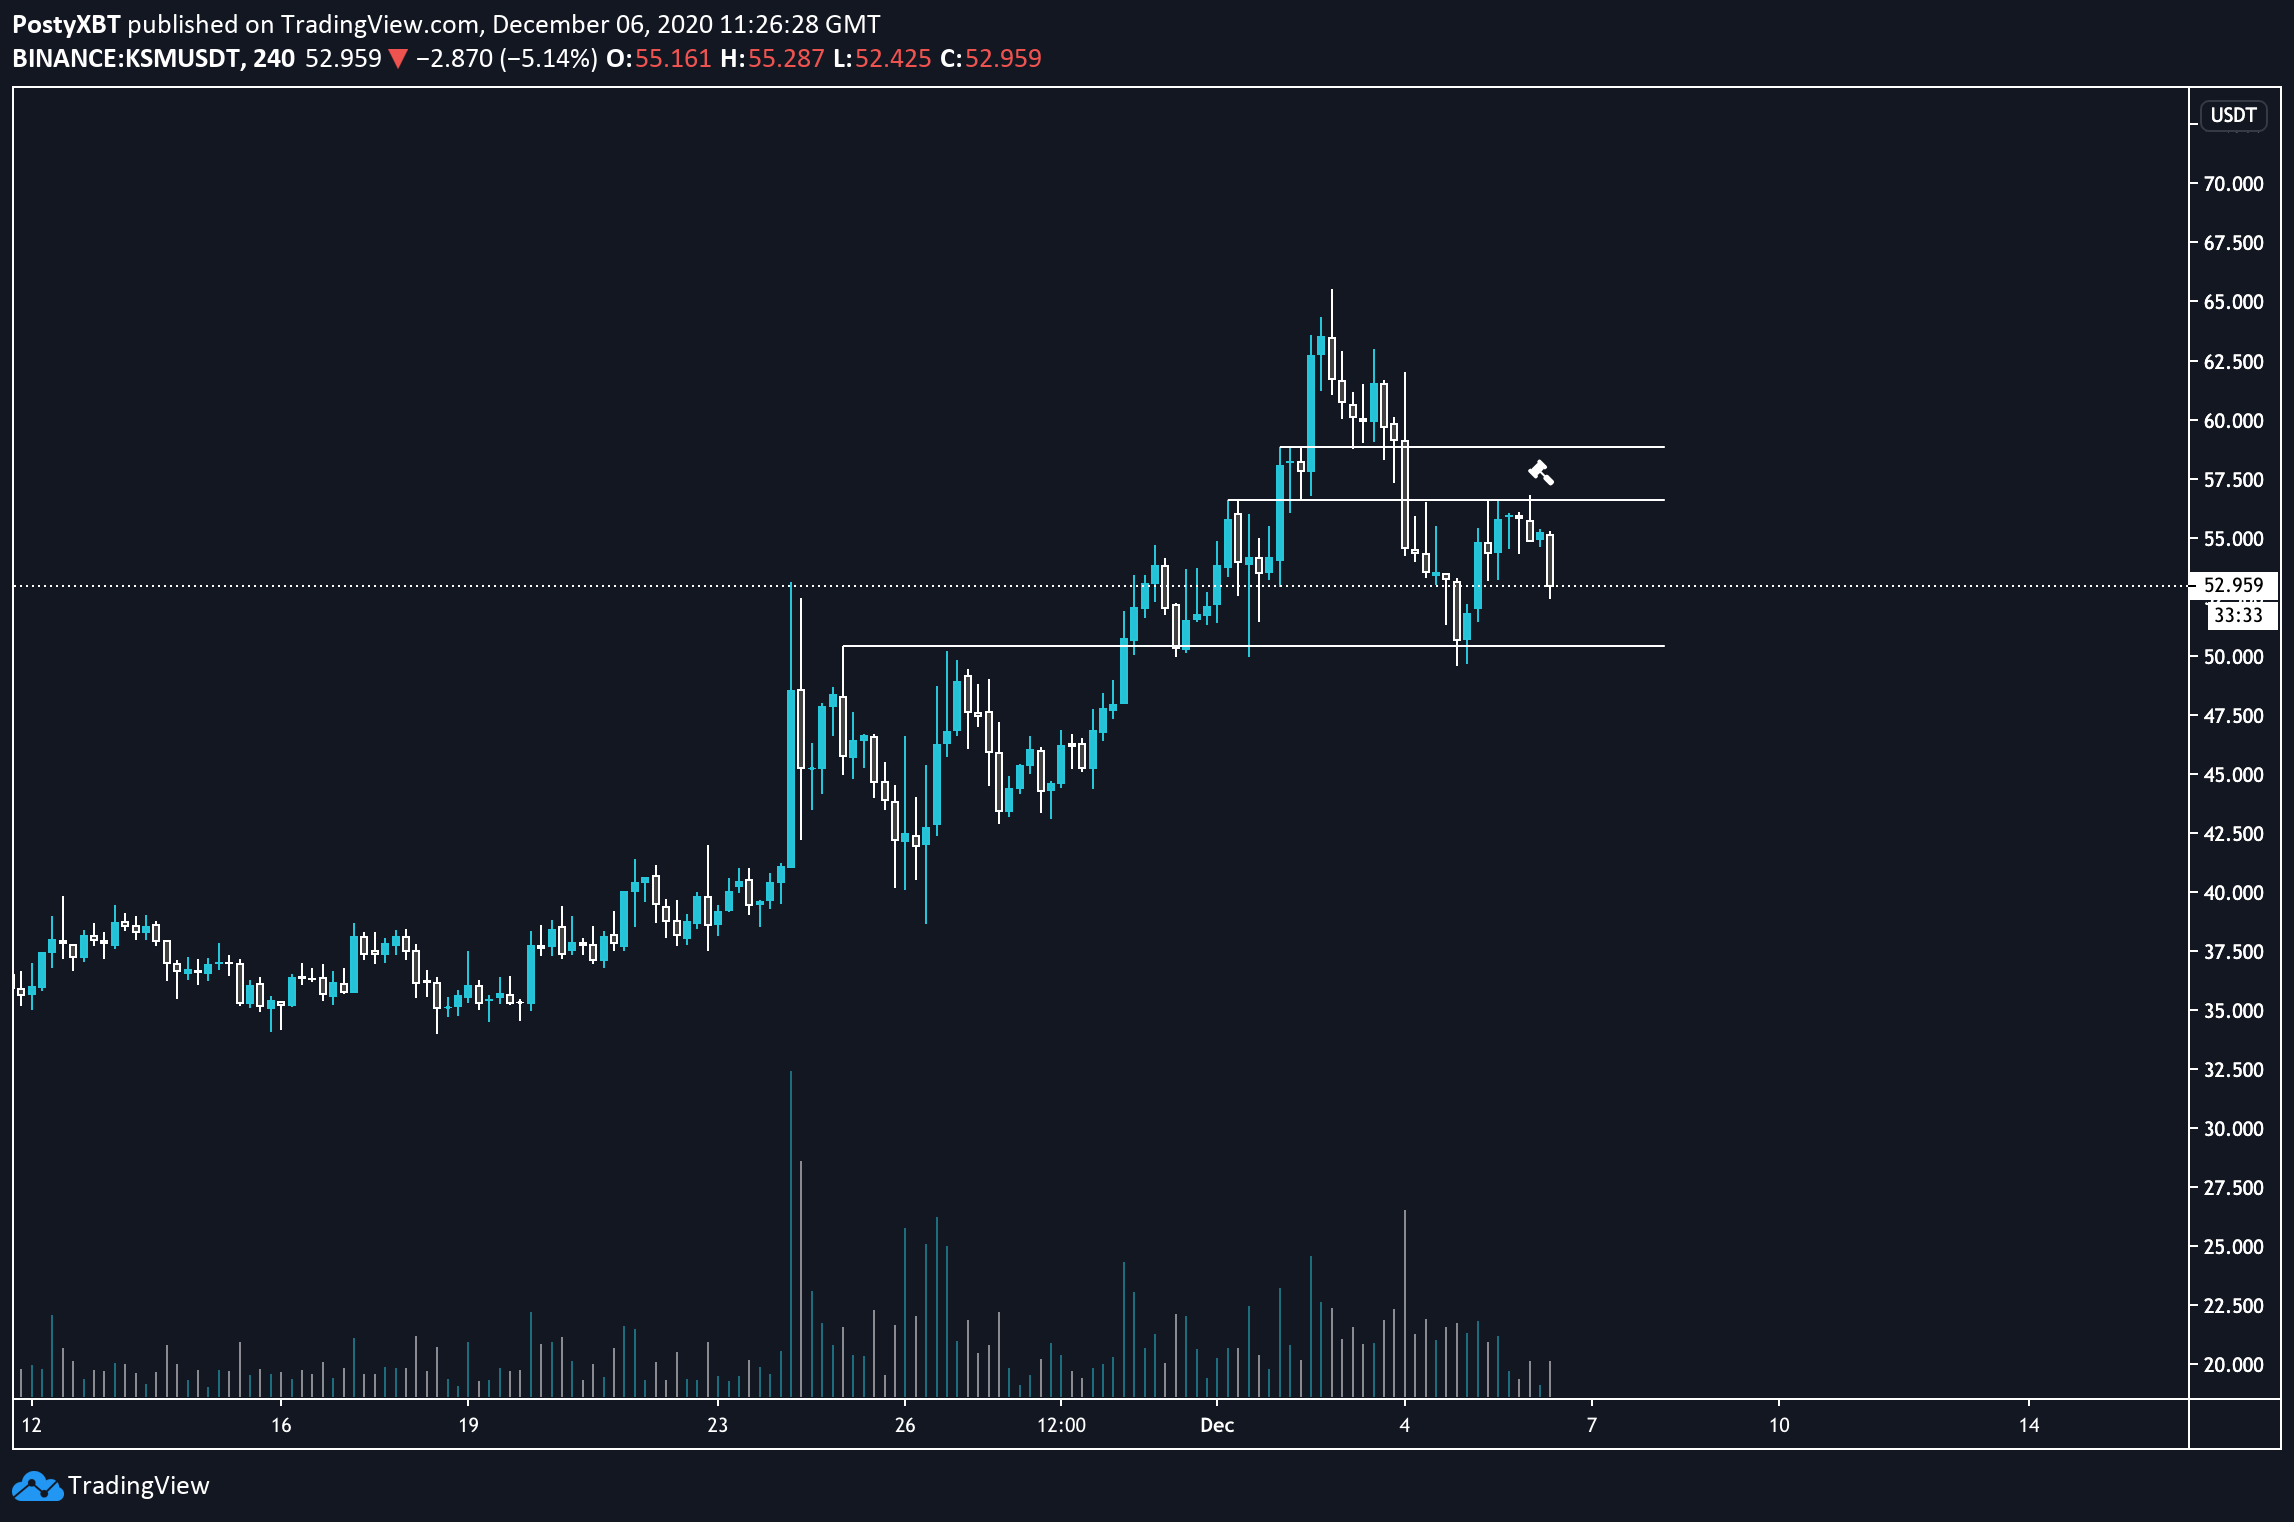
Cryptocurrency trader @postyxbt stated that a minor resistance level rejected the KSM price and should decline to at least $50.
Since the tweet, KSM has already hit this level and is in the process of creating a hammer candlestick. However, a look at lower time-frames is necessary to determine if KSM will break down or not.
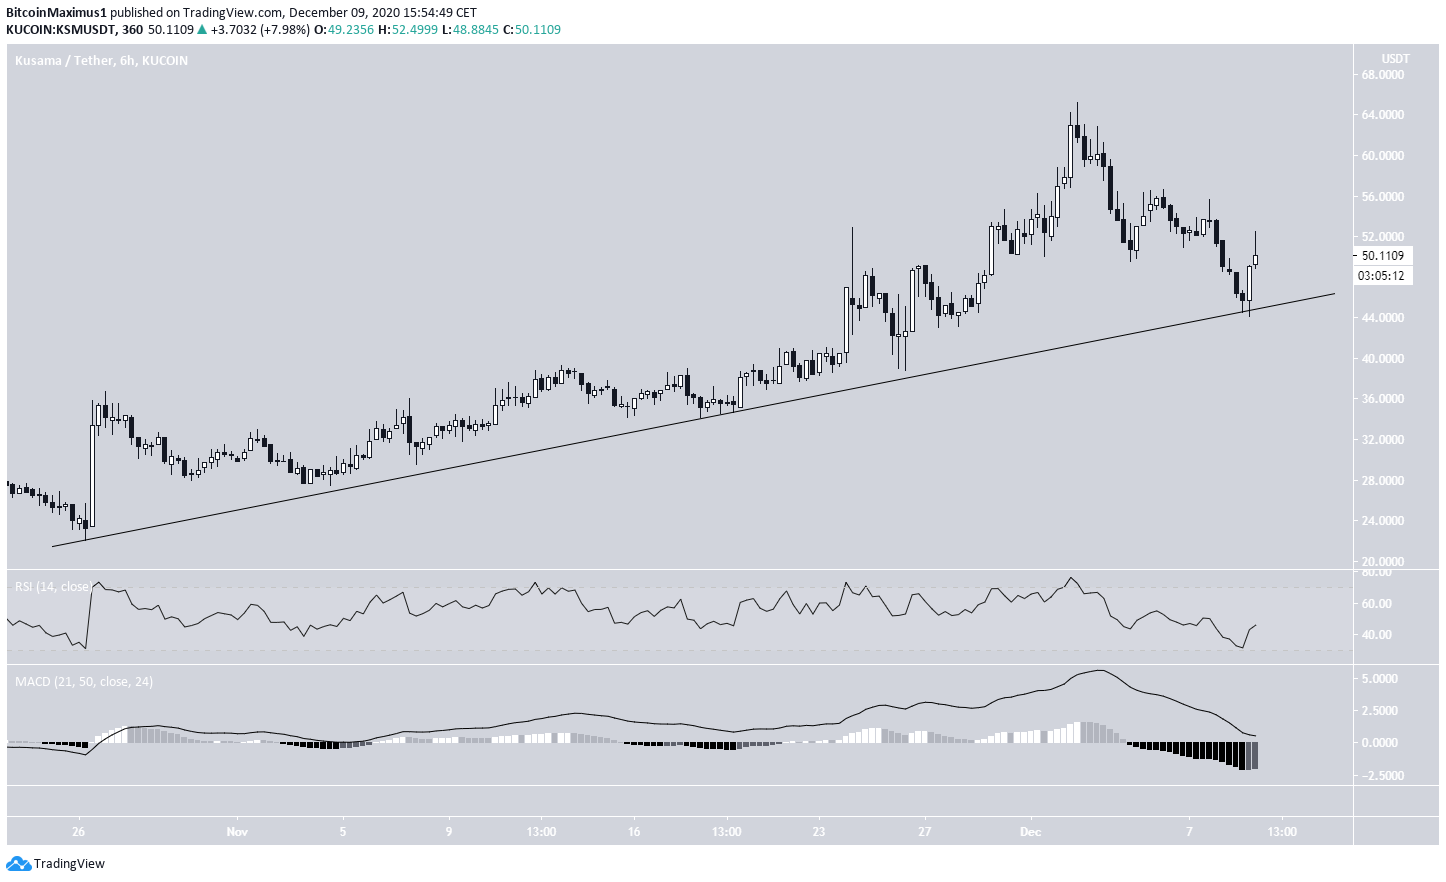
Future Movement
The shorter-term six-hour chart shows that KSM is following another ascending support line and has bounced just above it, increasing the legitimacy of the current support area.
Despite no clear bullish reversal signs, the MACD has possibly begun to move upwards and the RSI is close to crossing above 50.
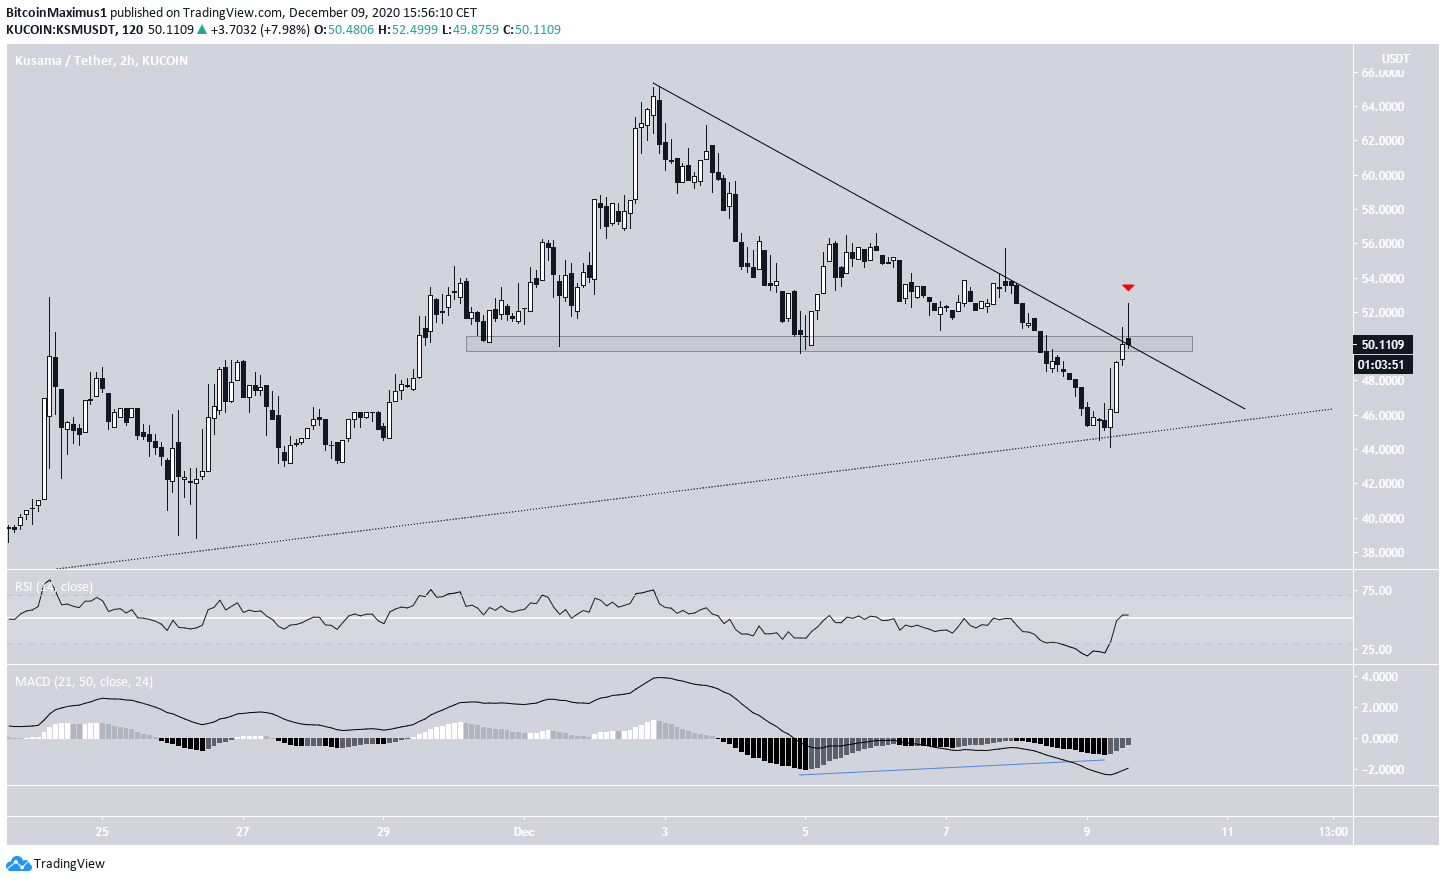
A look at the even smaller two-hour time-frame shows a bullish divergence in the MACD and a bullish movement by the RSI, further supporting the possibility of a reversal.
Once the price breaks out above the current descending resistance line and reclaims the $50 area, it is likely to continue moving upwards and attempt to break out to a new yearly high above $65.
Conclusion
To conclude, the KSM price should hold on above the current support area and eventually break out above the short-term descending resistance line.
On the other hand, a daily close below $48 would suggest that KSM is heading down to $39. At the current time, this doesn’t seem likely.
Disclaimer: Cryptocurrency trading carries a high level of risk and may not be suitable for all investors. The views expressed in this article do not reflect those of BeInCrypto.