The Tomochain (TOMO) price has been struggling to break out from a descending resistance line since Aug. 13.
Technical indicators are bearish, suggesting that another drop towards the support area outlined below is likely before the price makes another breakout attempt.
TOMO Attempts to Break Out
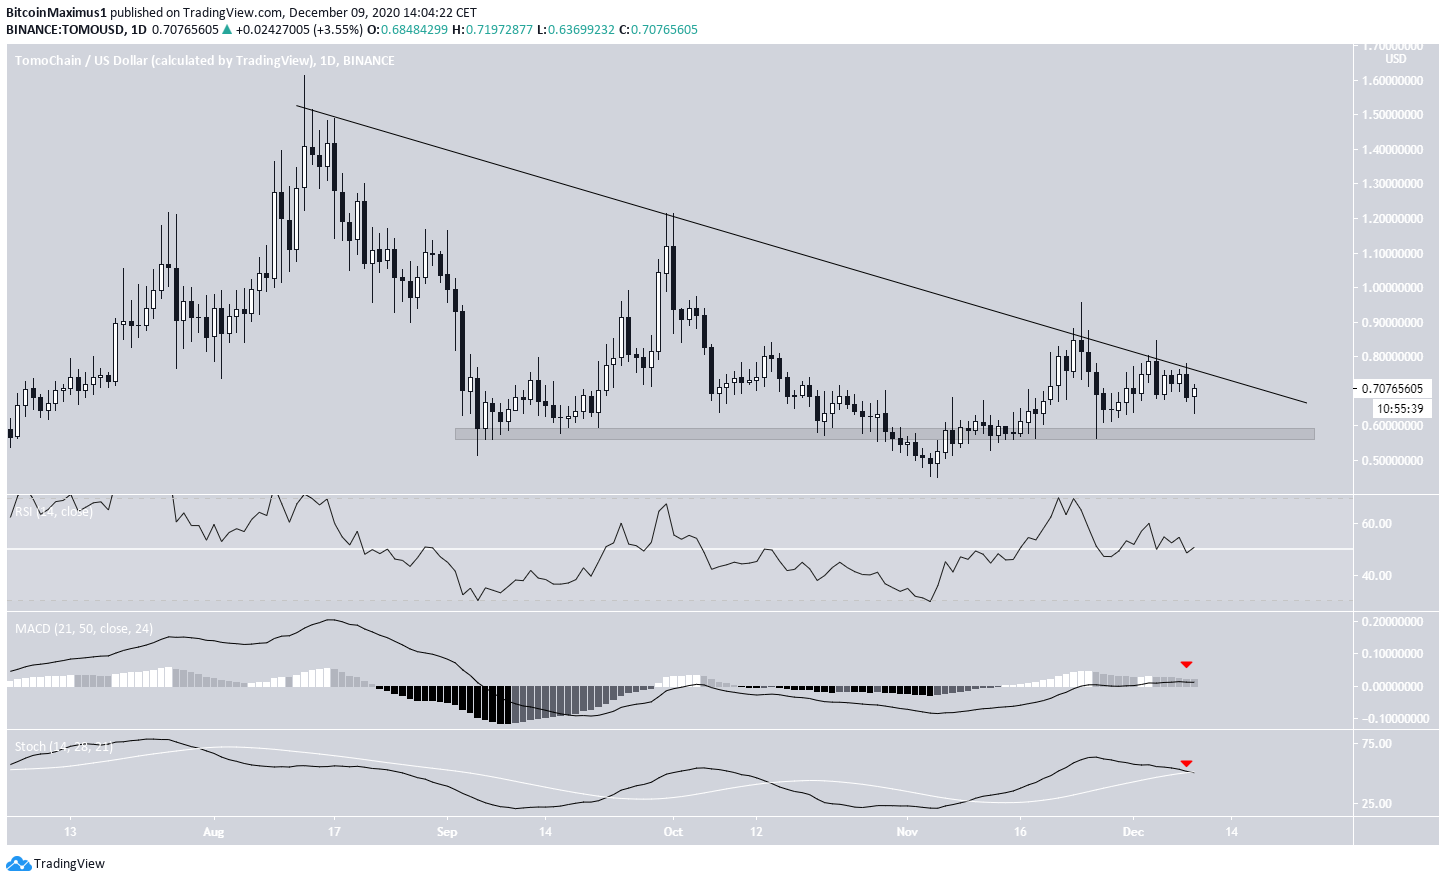
TOMO has been following a descending resistance line since it reached a high of $1.61 on Aug. 13. At the time of writing, it was trading only slightly below the line, having previously made five unsuccessful attempts to break out.
The closest support area is at $0.56, having been in place since the beginning of Sept. There was one exception at the beginning of Nov with a brief deviation below.
The point of convergence between the support area and the resistance line is approaching, at which point a decisive move has to occur.
Technical indicators are neutral/bearish, failing to provide confirmation on the direction of the move. The RSI is right at the 50 line. The MACD is above 0 but has lost its strength while the Stochastic Oscillator has just made a bearish cross.
Therefore, a look at lower time-frames is necessary to determine where the price will be heading next.
Short-Term Movement
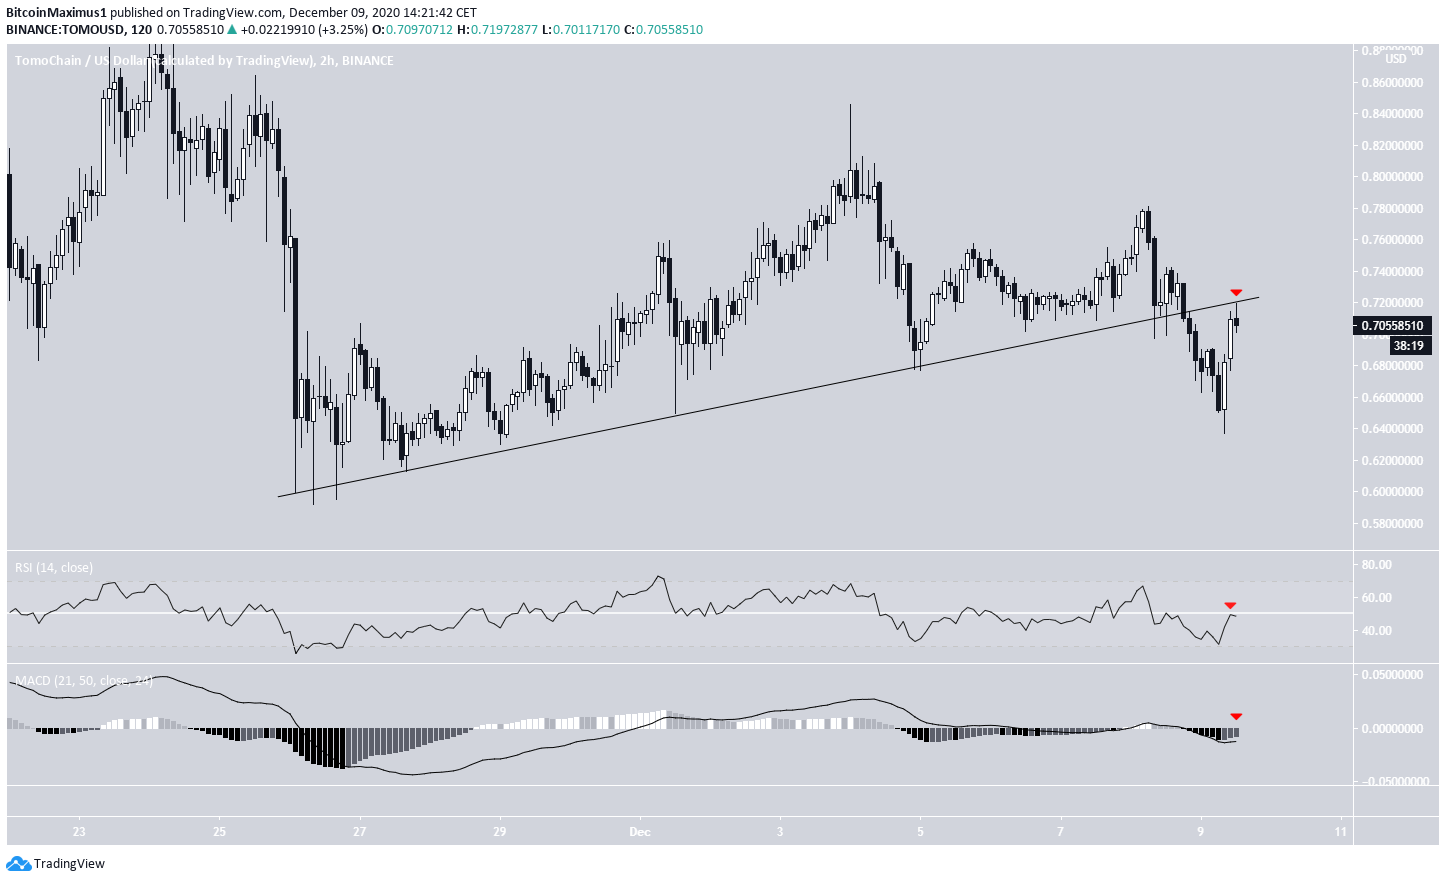
The shorter-term two-hour chart shows that TOMO has already broken down from an ascending support line and is currently in the process of validating it as resistance (shown with the red arrow below).
Both the MACD and RSI are bearish, supporting the legitimacy of the breakdown and suggesting that TOMO should head towards the $0.56 support area again.
TOMO/BTC
Cryptocurrency trader @CryptoMichNL outlined a TOMO/BTC chart, which shows that the price is trading inside a long-term support level. A significant upward move could begin here.
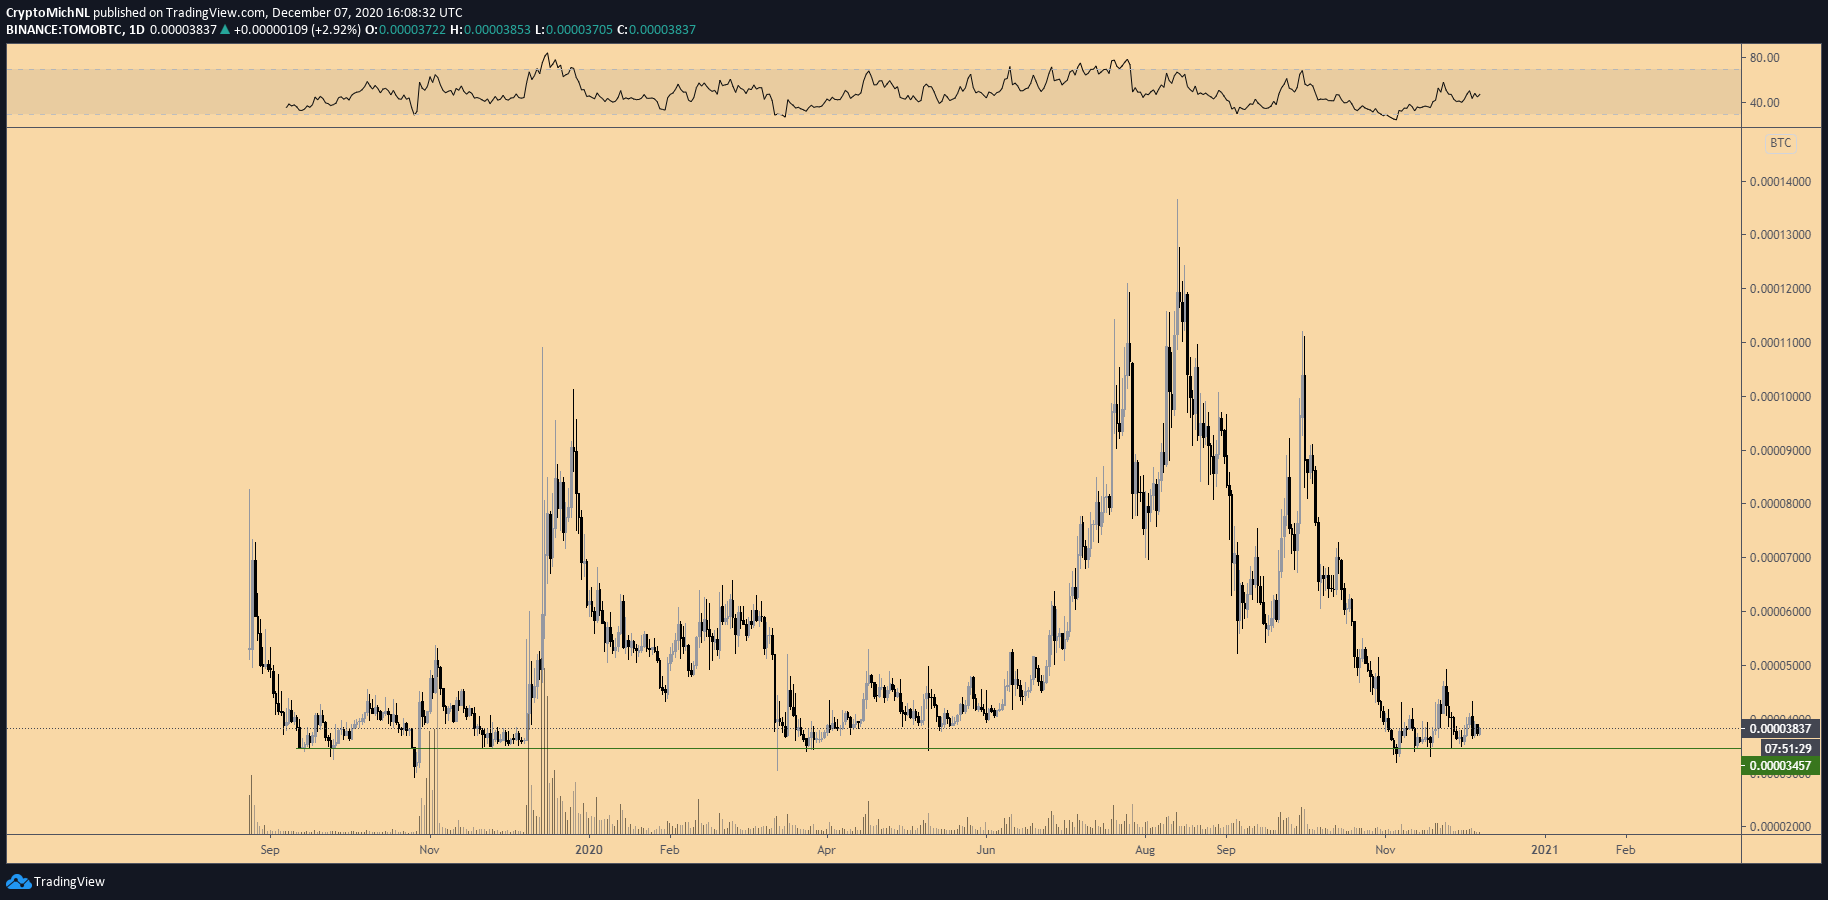
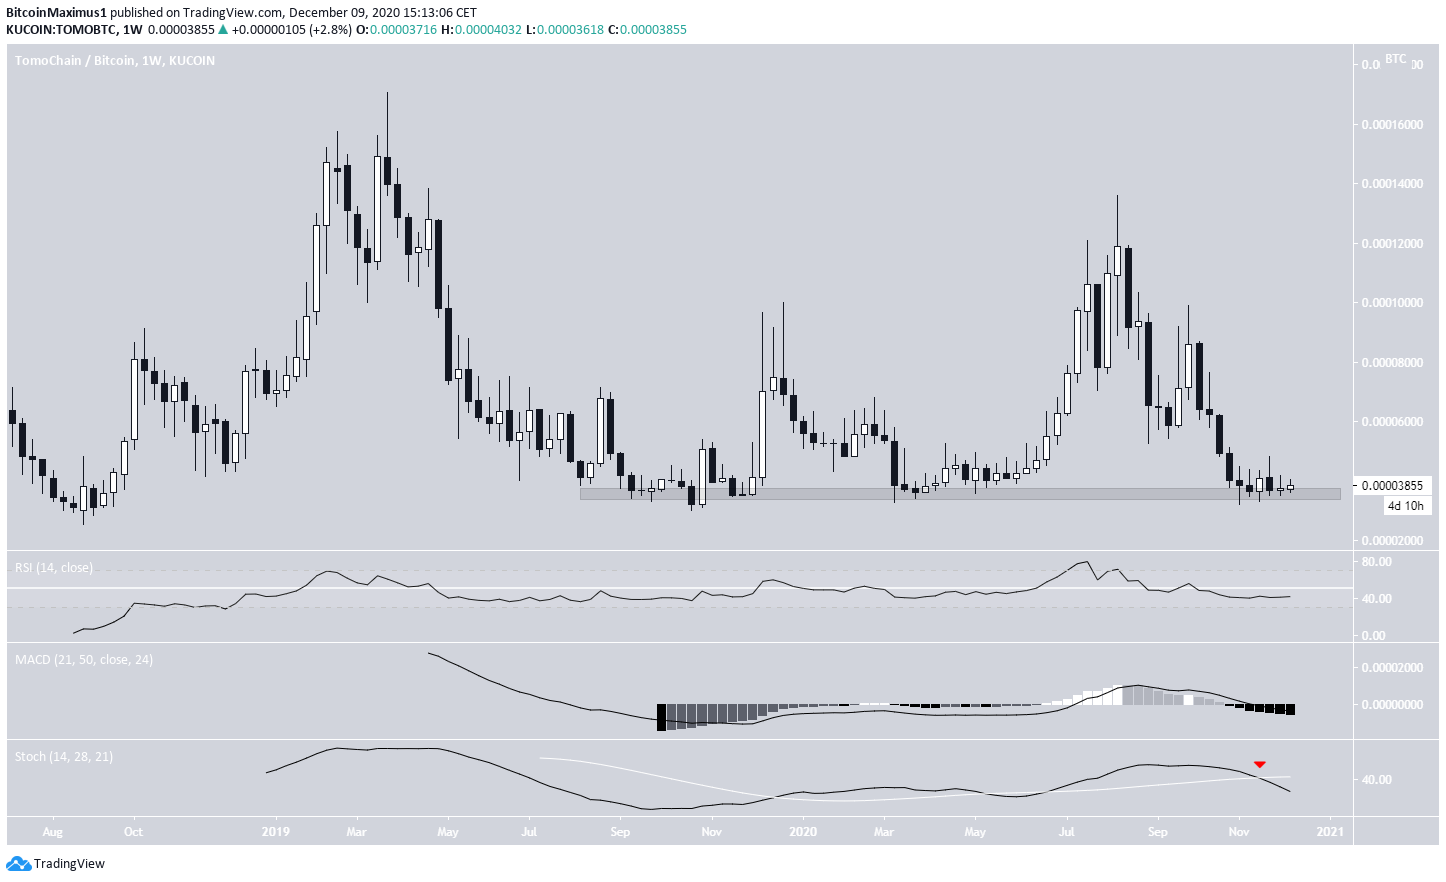
The TOMO/BTC price is trading right inside the 3800 satoshi support area, a level which has held since Sept. 2019. This is the fourth time the level has been touched. An upward move began each of the previous three times.
However, technical indicators don’t yet show any reversal signs, so it’s possible that TOMO continues accumulating inside this range for a while before eventually moving upwards. This would also fit with the reading from the TOMO/USD pair.
Conclusion
To conclude, the TOMO/USD pair should decline once more until it reaches the $0.56 support area, before possibly beginning to move upwards.
The TOMO/BTC pair seems to be accumulating inside the 3800 satoshi support area but has not given any bullish reversal signs yet, indicating that it might take a while before it begins to rally.
Disclaimer: Cryptocurrency trading carries a high level of risk and may not be suitable for all investors. The views expressed in this article do not reflect those of BeInCrypto.