The Aave (AAVE) price reached an all-time high on Dec. 7 but created a bearish pattern and broke down from its structure shortly afterwards.
AAVE should continue moving down towards the support levels outlined in the article.
New All-Time High
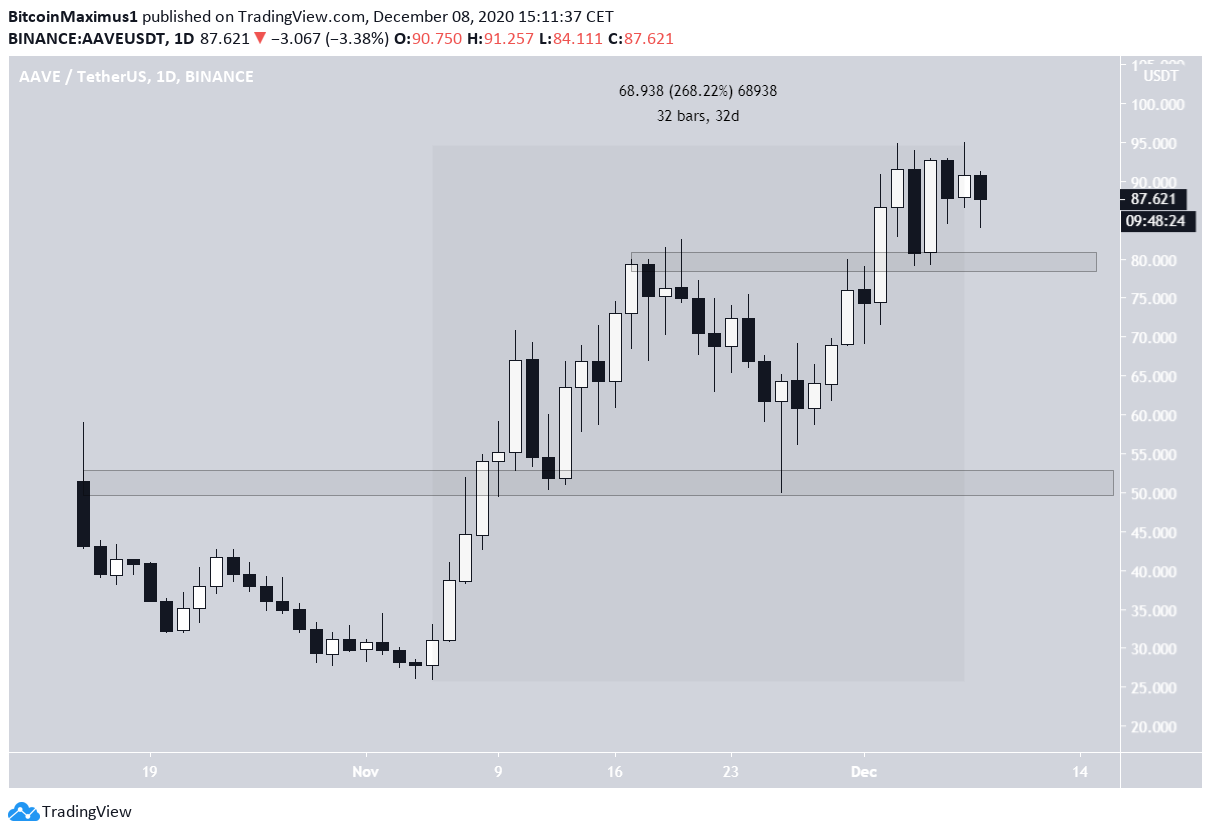
The AAVE price has been moving upwards since Nov. 5, when it reached a low of $25.93. The rally continued until AAVE reached a new all-time high of $95 on Dec. 7. This measured an increase of 268% in 32 days.
After this high, AAVE dropped slightly to below $90, where it’s currently trading. If AAVE were to continue dropping, the closest support area is at $80, while the next one is all the way down at $50.
Triple Top Leads to Breakdown
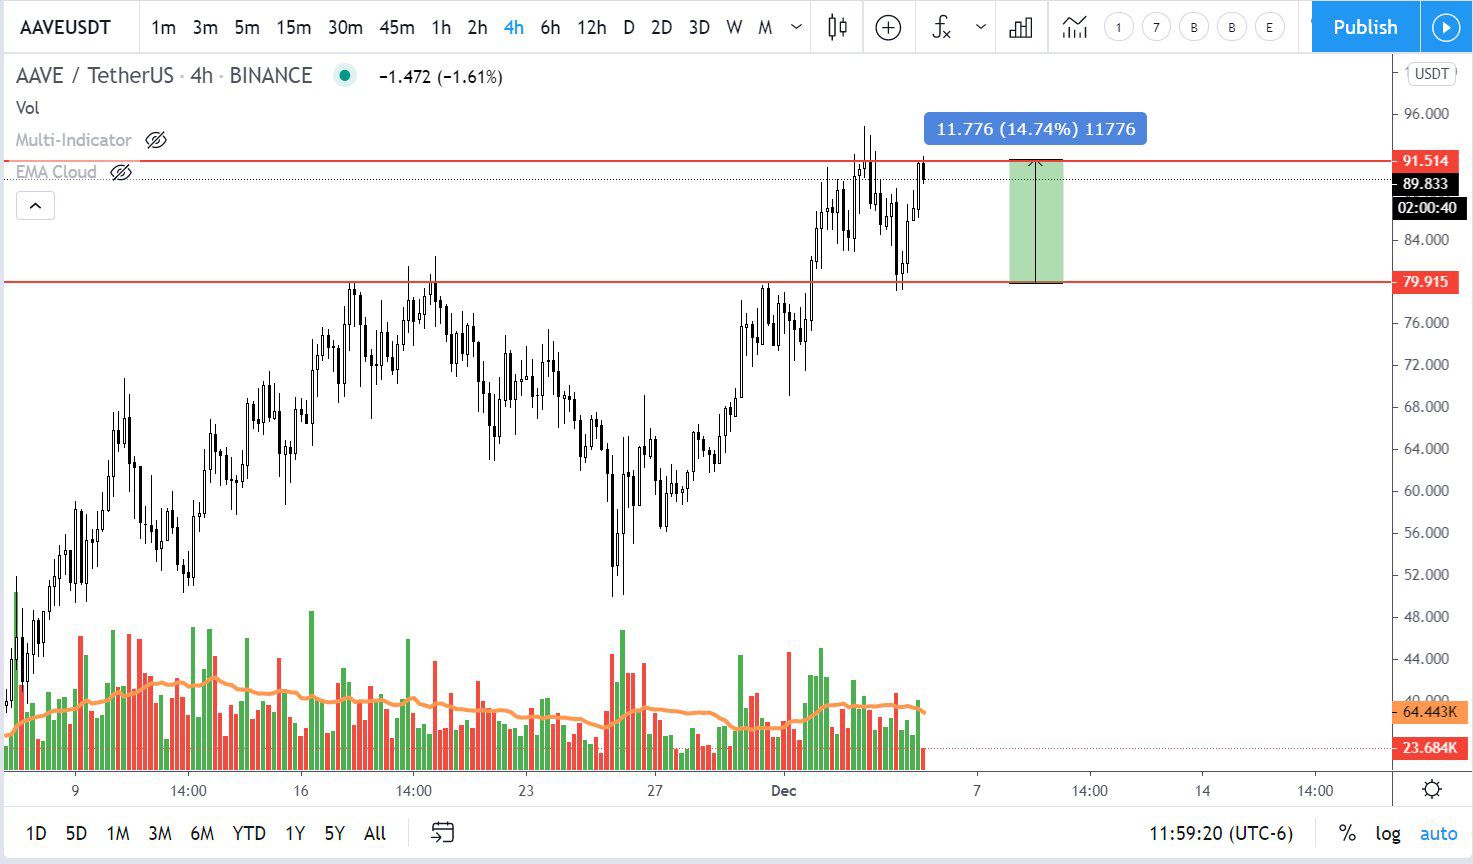
Cryptocurrency trader @Devchart outlined an AAVE chart stating that he is taking profit near the current level due to the possibility of a breakdown.
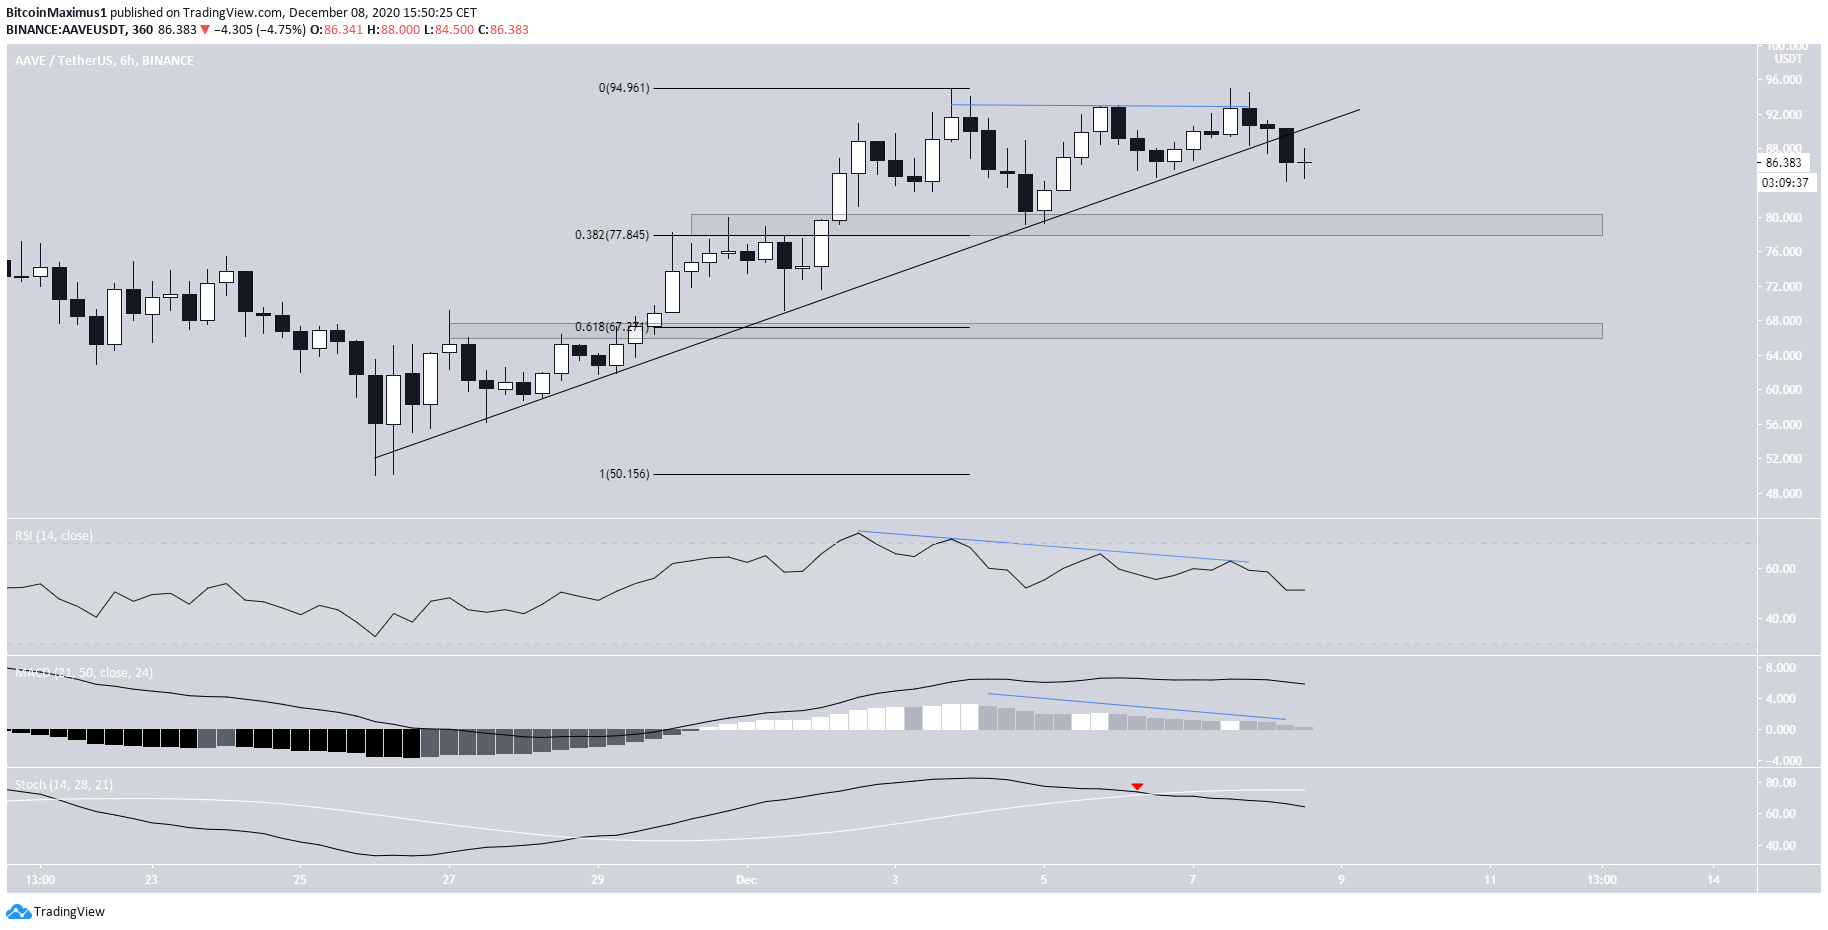
Since reaching a low of $50 on Nov. 25, AAVE had been following an ascending support line, which led to the previously mentioned all-time high price.
However, AAVE also created a triple top near $94, which is a bearish reversal pattern. It subsequently broke down from the support line.
Furthermore, the pattern also has bearish divergence on both the RSI and MACD, while the Stochastic Oscillator has just made a bearish cross.
This suggests that AAVE is likely to continue falling, with the first minor support being near $78, coinciding with the $80 support area outlined previously. The next one is located at $67.
DeFi Index
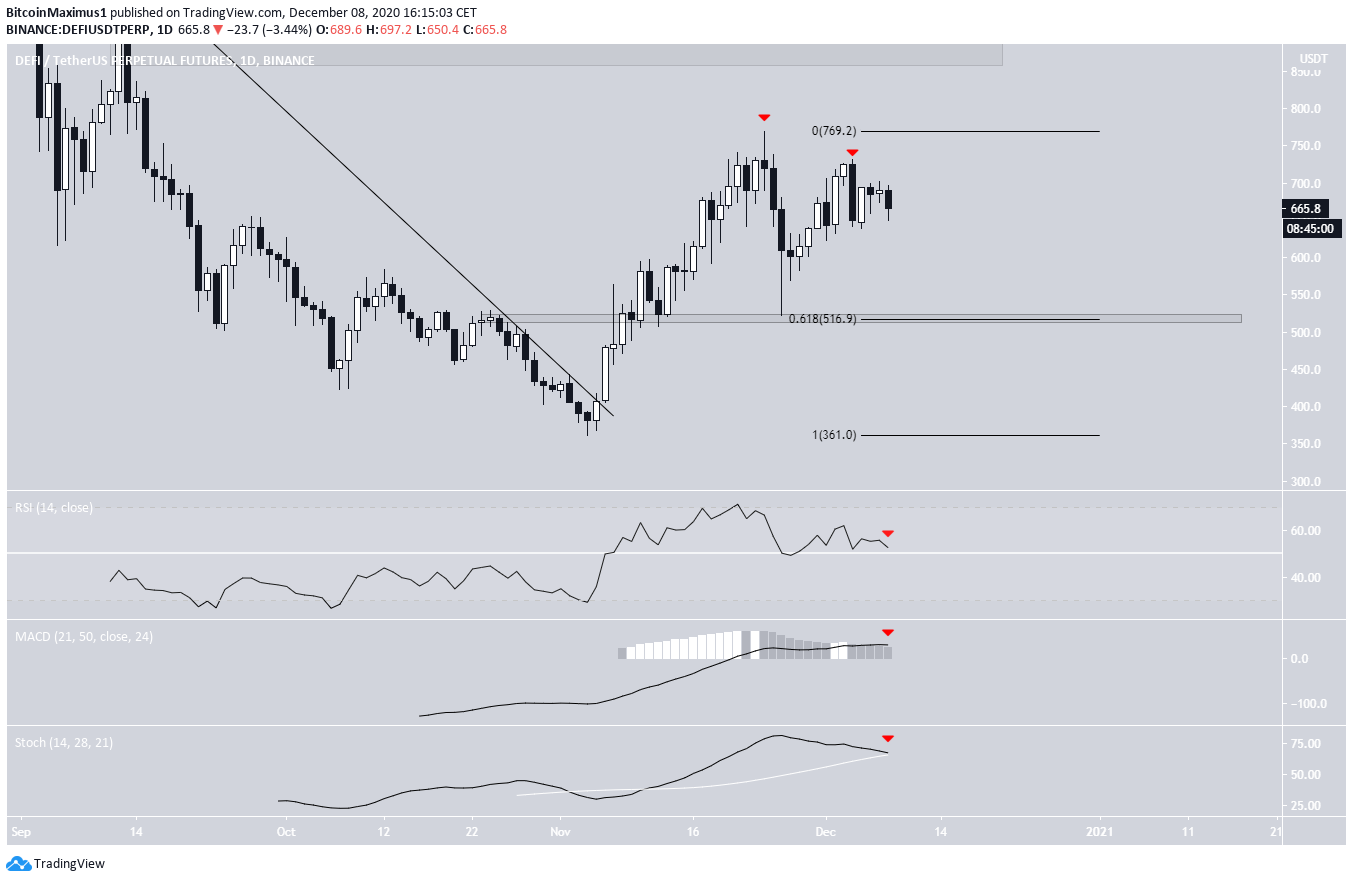
The DEFI index has been decreasing since Nov. 24, when it reached a high of $769.8. The index created a shooting star candlestick and proceeded to fall shortly afterward, reaching a low of $522.3 on Nov. 26.
The ensuing decline led to a lower high and a bearish engulfing candlestick on Dec.4.
Technical indicators are bearish, and the bearish trend will be confirmed once the Stochastic Oscillator makes a bearish cross and the RSI falls below 50. Both of these events are very close to happening.
Therefore, the DeFI index should decrease once more and reach the $515 support area.
Conclusion
To conclude, the AAVE price is likely to continue falling towards $80 and possibly $67. Similarly, the DeFi index should drop towards $516.
Disclaimer: Cryptocurrency trading carries a high level of risk and may not be suitable for all investors. The views expressed in this article do not reflect those of BeInCrypto.