The VeChain (VET) price is trading inside a long-term resistance level and is possibly also inside a corrective structure.
A breakdown from the current short-term pattern could cause a sharp drop towards the support levels outlined in the article.
VET Reaches Resistance
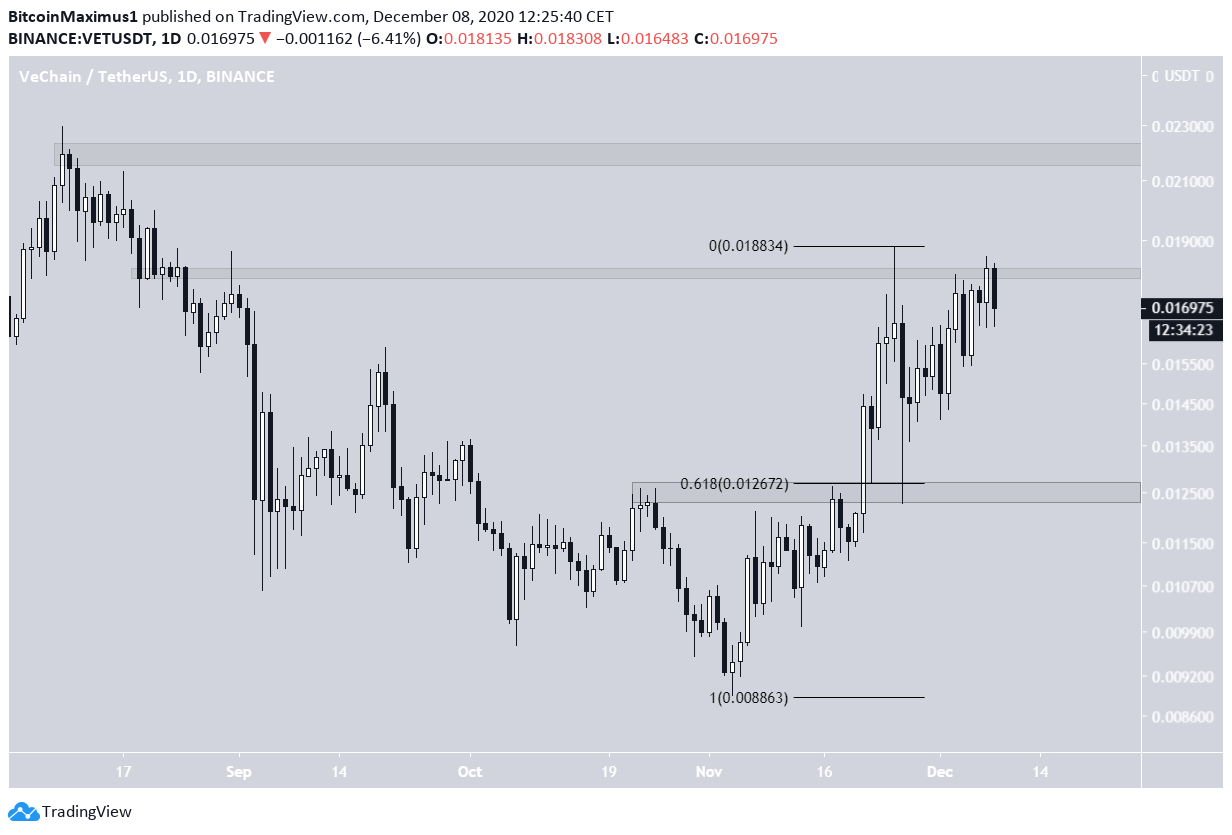
VET has been moving upwards since it reached a low of $0.0091 on Nov.5. The upward move culminated in a high of $0.0188 on Nov. 25. However, the highs could not be sustained and VET dropped sharply afterward.
Currently, VET has reached the area again but is being beaten back by the bears. If it drops further, the closest support area would be at $0.0125, a horizontal support level and the 0.618 fib retracement of the entire upward move.
The next closest resistance area is at $0.022.
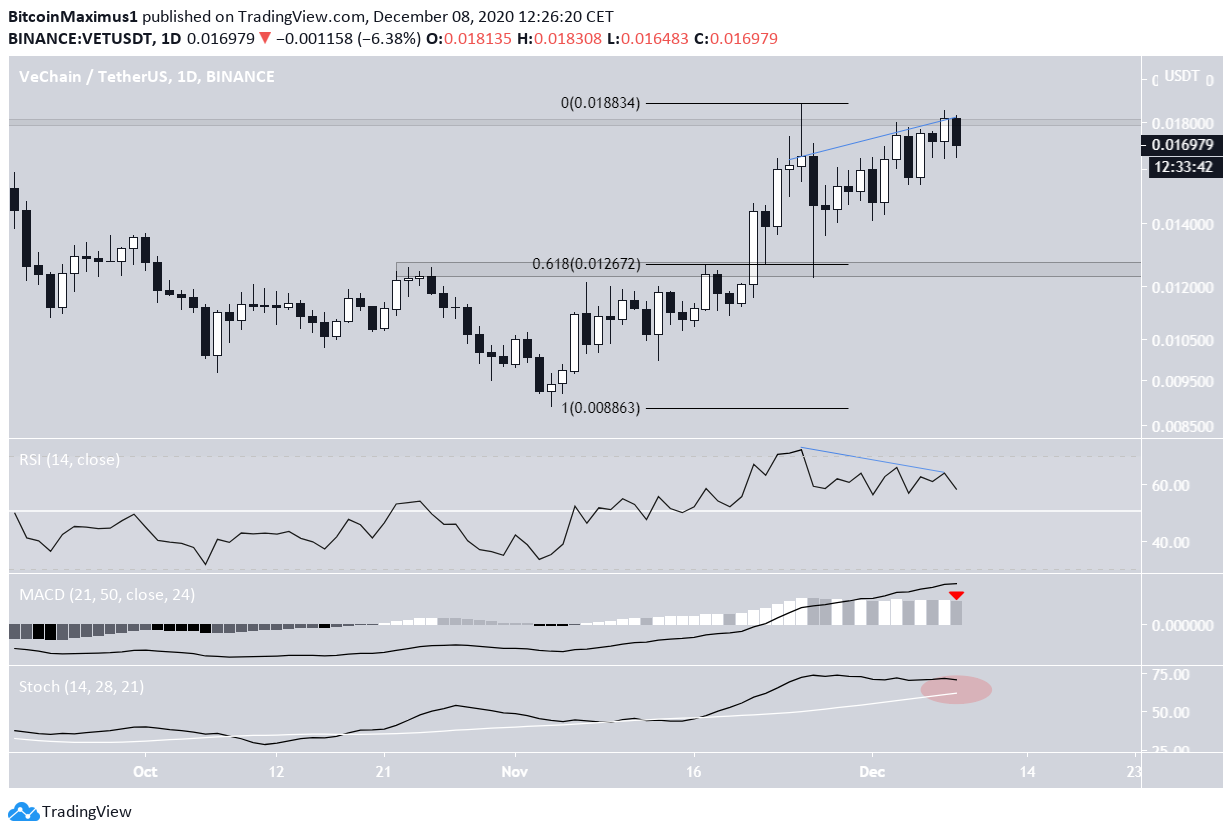
Technical indicators on the daily time-frame are leaning bearish. The RSI has formed bearish divergence and is falling. The MACD has lost its strength and the Stochastic Oscillator is in the process of making a bearish cross.
The bearish trend would be confirmed by an RSI decline below 50 and a bearish cross in the Stochastic Oscillator.
Possible Breakdown
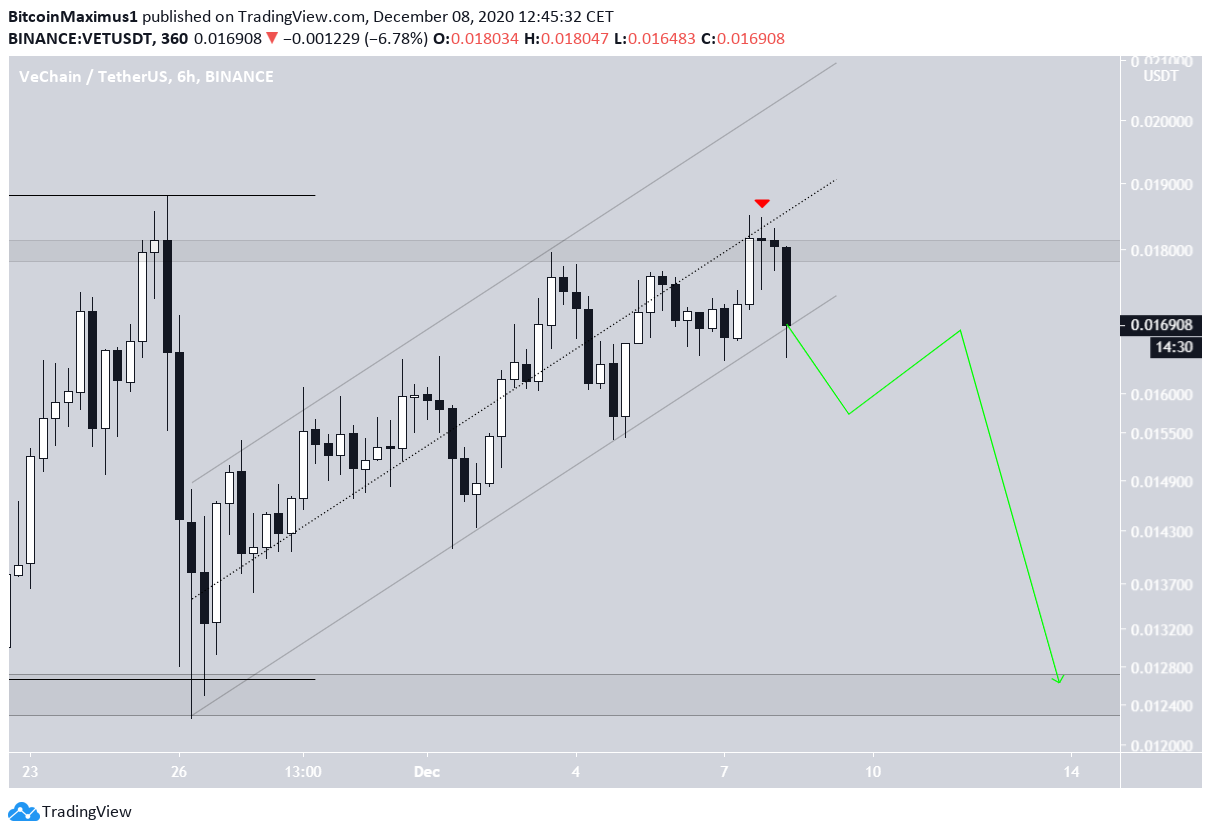
A closer look at the six-hour chart reveals that VET is trading inside a parallel ascending channel. Yesterday, it was rejected at the middle of the channel and has dropped sharply since.
Parallel channels are usually corrective structures, and the overlap inside suggests that this is indeed a correction and that it could soon break down. This fits with the movement outlined on the daily time-frame.
A breakdown from the channel could take the price all the way to the previously outlined support area at $0.0125.
VET/BTC
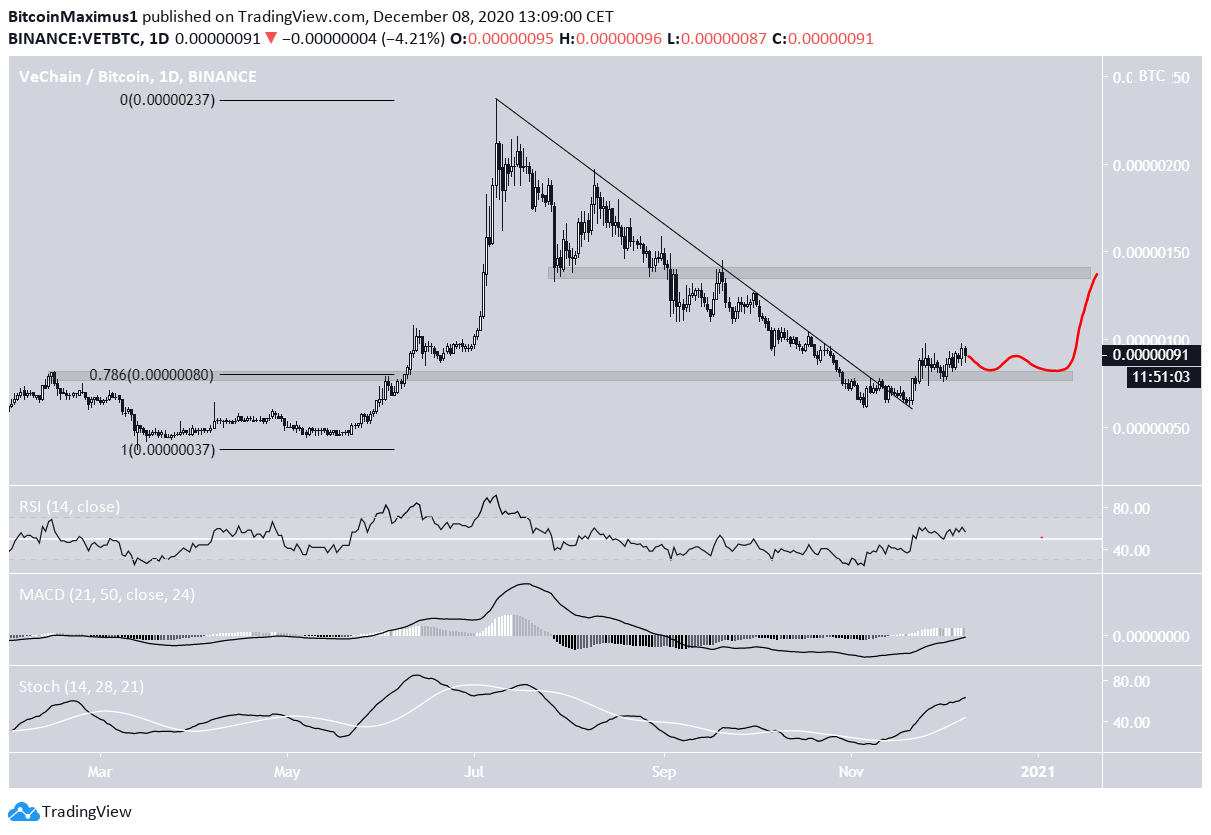
Cryptocurrency trader @scottmelker outlined a VET/BTC chart, stating that it has broken out from a long-term pattern and is likely to move higher.
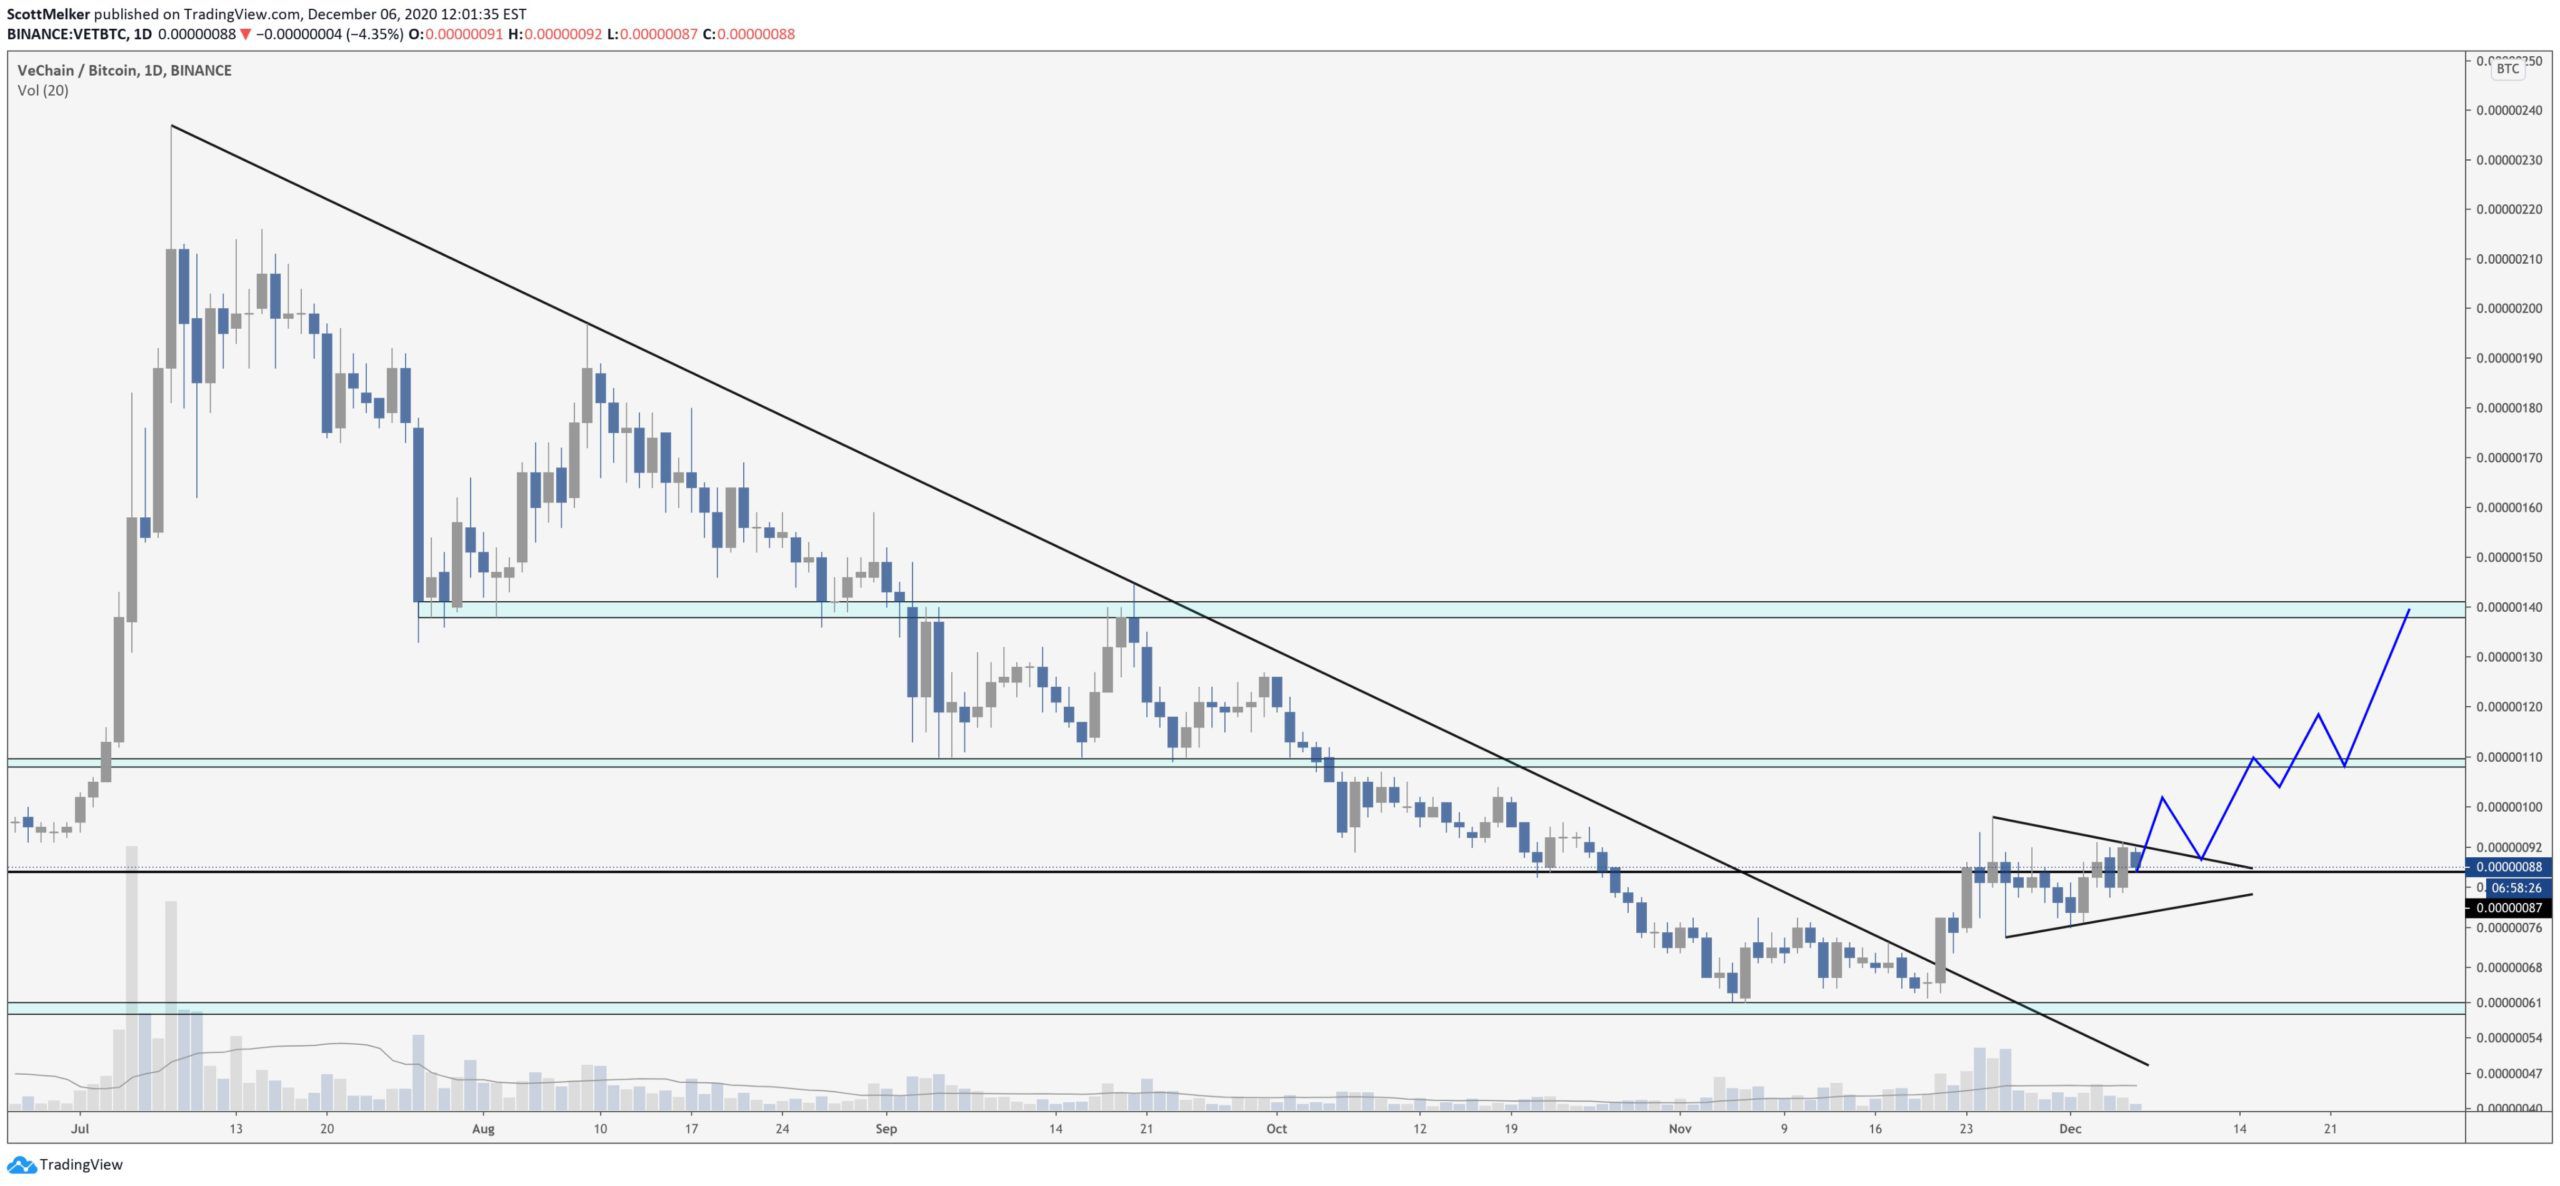
Indeed, the VET/BTC pair has broken out from a descending resistance line that had been in place since Jul. 6. After the breakout, price action moved above the 80 satoshi area and has seemingly validated it as support.
Technical indicators are bullish and support the continuation of the upward movement, with a possible target at the resistance area of 140 satoshis.
Due to the bearishness in the VET/USD pair, the most likely scenario would be a slight drop and consolidation inside the 80 satoshi support area before an eventual upward movement towards 140 satoshis.
Conclusion
To conclude, the VET/USD pair should soon break down from its parallel channel and continue moving downwards towards the support area at $0.0125.
On the other hand, the VET/BTC pair has broken out from a descending resistance line and could eventually move upwards after a period of consolidation.
Disclaimer: Cryptocurrency trading carries a high level of risk and may not be suitable for all investors. The views expressed in this article do not reflect those of BeInCrypto.