Since reaching a high of $0.79 on Nov. 24, the XRP price has been consolidating inside a symmetrical triangle.
XRP should break out from this triangle and increase towards the resistance levels given below.
Consolidation After High
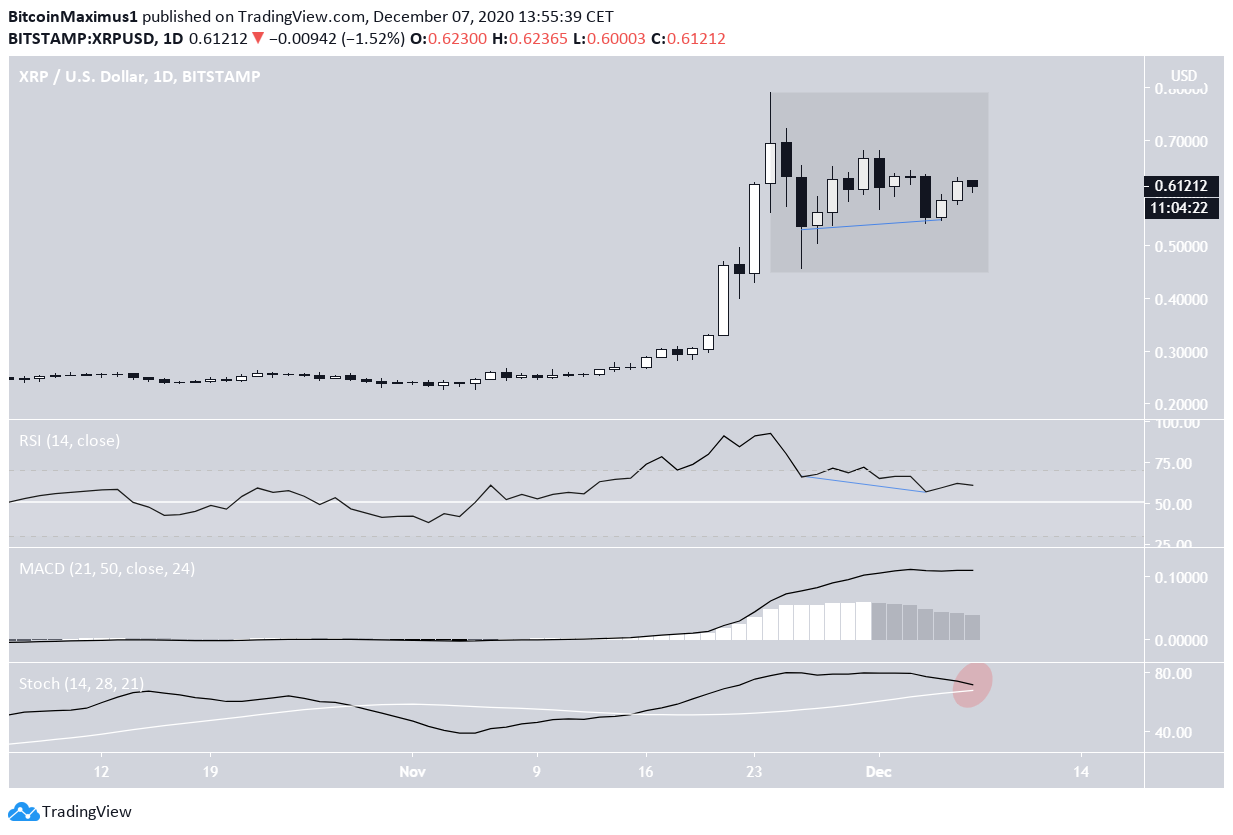
The XRP price has been moving downwards since reaching a high of $0.79 on Nov. 24.
With the exception of the first two days after the high was reached, the drop hasn’t been sharp, rather the price has been consolidating in a range between $0.55 and $0.65.
Technical indicators are neutral, leaning slightly bullish:
- The RSI has formed hidden bullish divergence and is above 50.
- The MACD histogram is decreasing and its line is considerably above 0.
- The Stochastic Oscillator is moving downwards but hasn’t yet made a bearish cross.
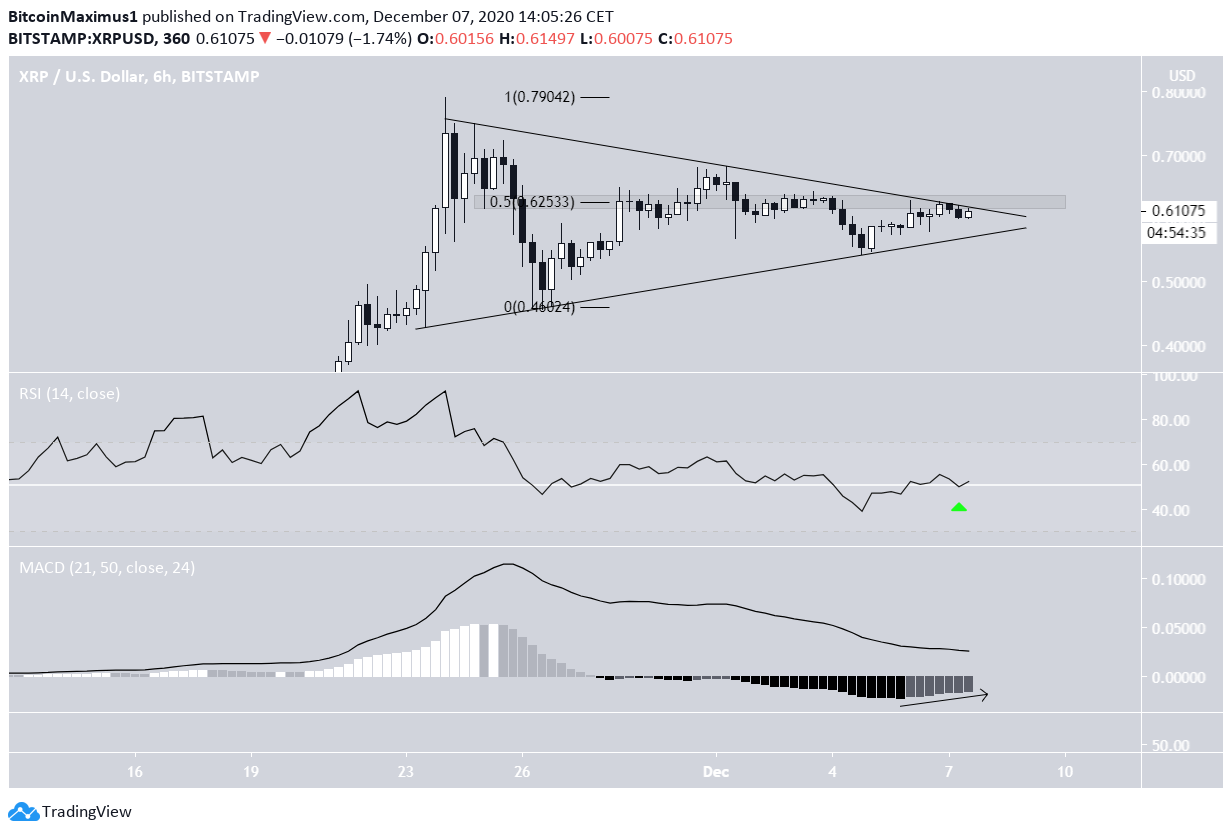
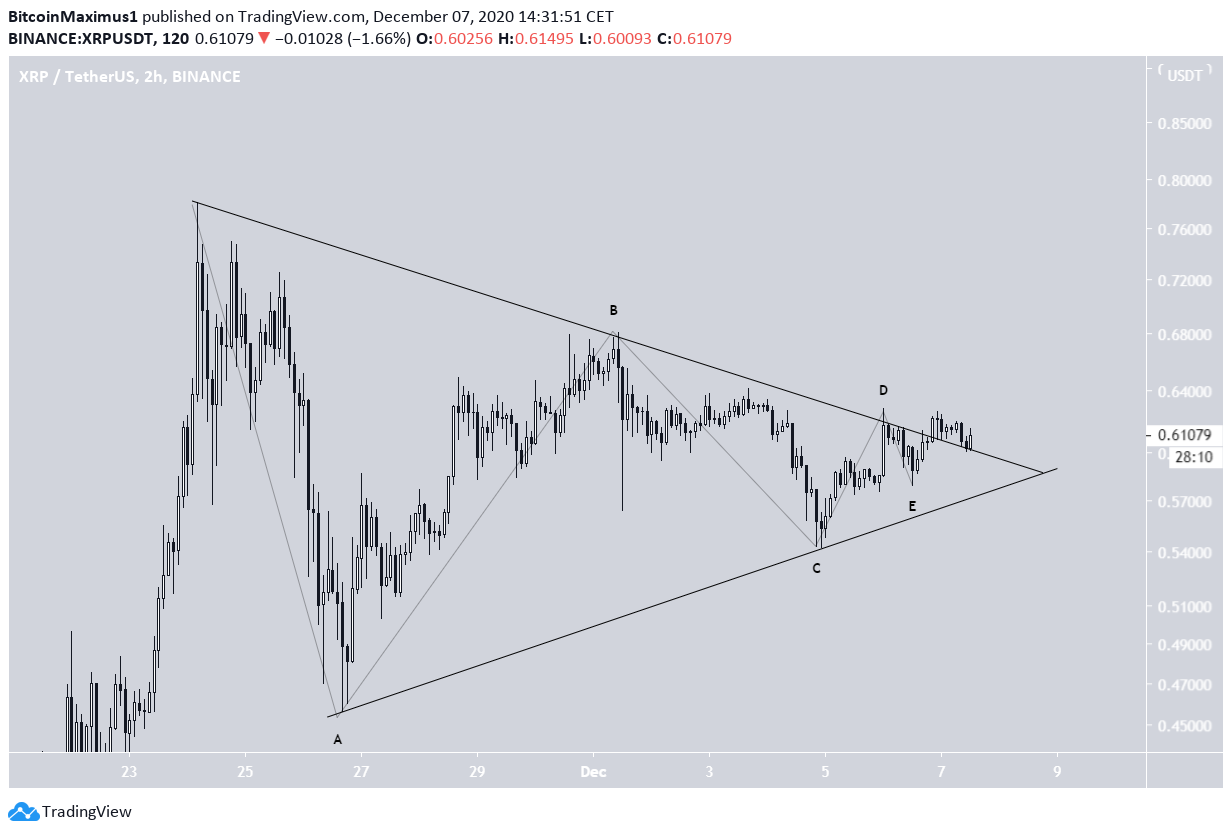
The shorter-term time-frame provides a more bullish outlook. XRP has been trading inside a symmetrical triangle since it reached the previous high and is currently very close to the resistance line.
The line also coincides with the $0.625 horizontal resistance area, so a breakout above here would likely trigger a sharp upward move.
Both the RSI and the MACD support the possibility of a breakout that would likely take the target towards $0.79 and possibly higher.
Long-Term Levels
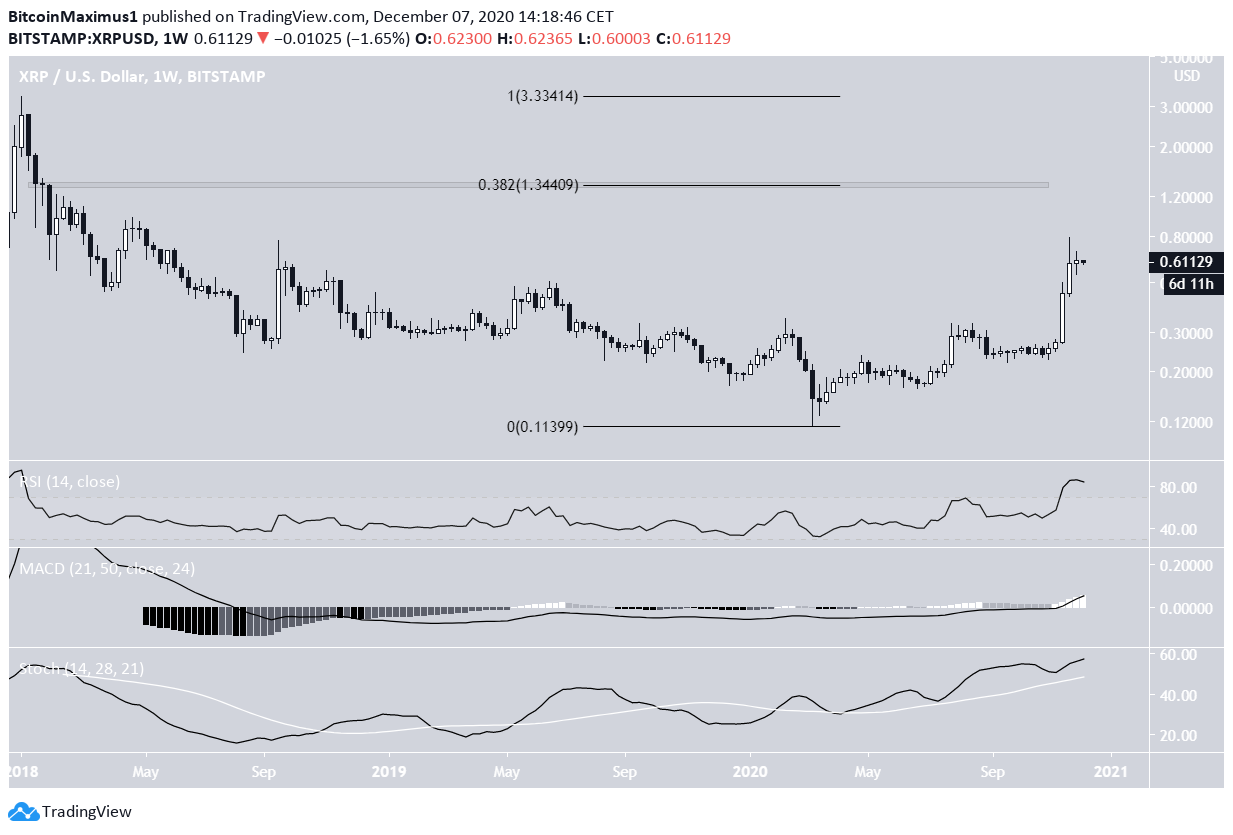
The weekly chart for XRP shows that if successful in breaking out, the next resistance area would be found all the way up at $1.34, the 0.382 Fib retracement level measured from the all-time high price.
The MACD, RSI, and Stoch support the possibility of this rally, even if they show that it’s overbought.
(Note – The logarithmic chart is used to better visualize large price fluctuations)
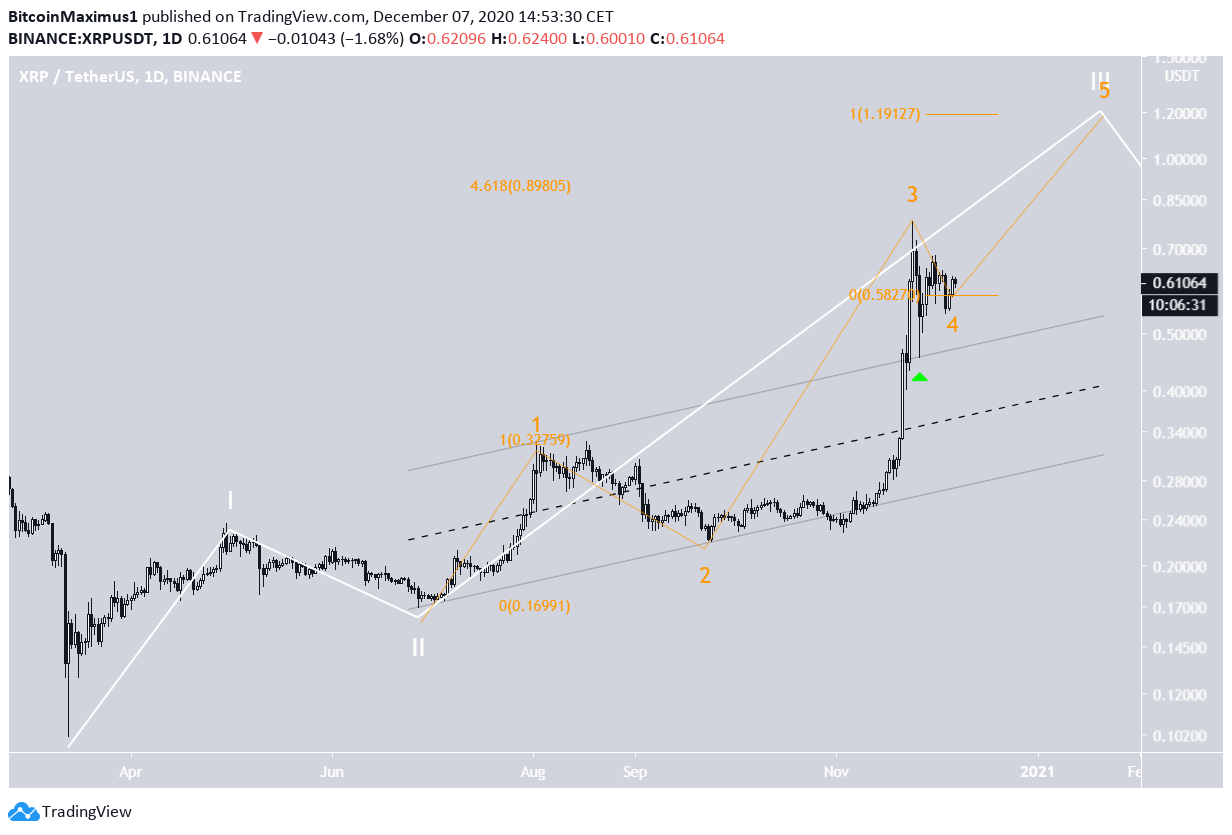
XRP Wave Count
Cryptocurrency trader @Thetradinghubb outlined an XRP chart, stating that the price is trading inside a symmetrical triangle, from which a breakout is likely.
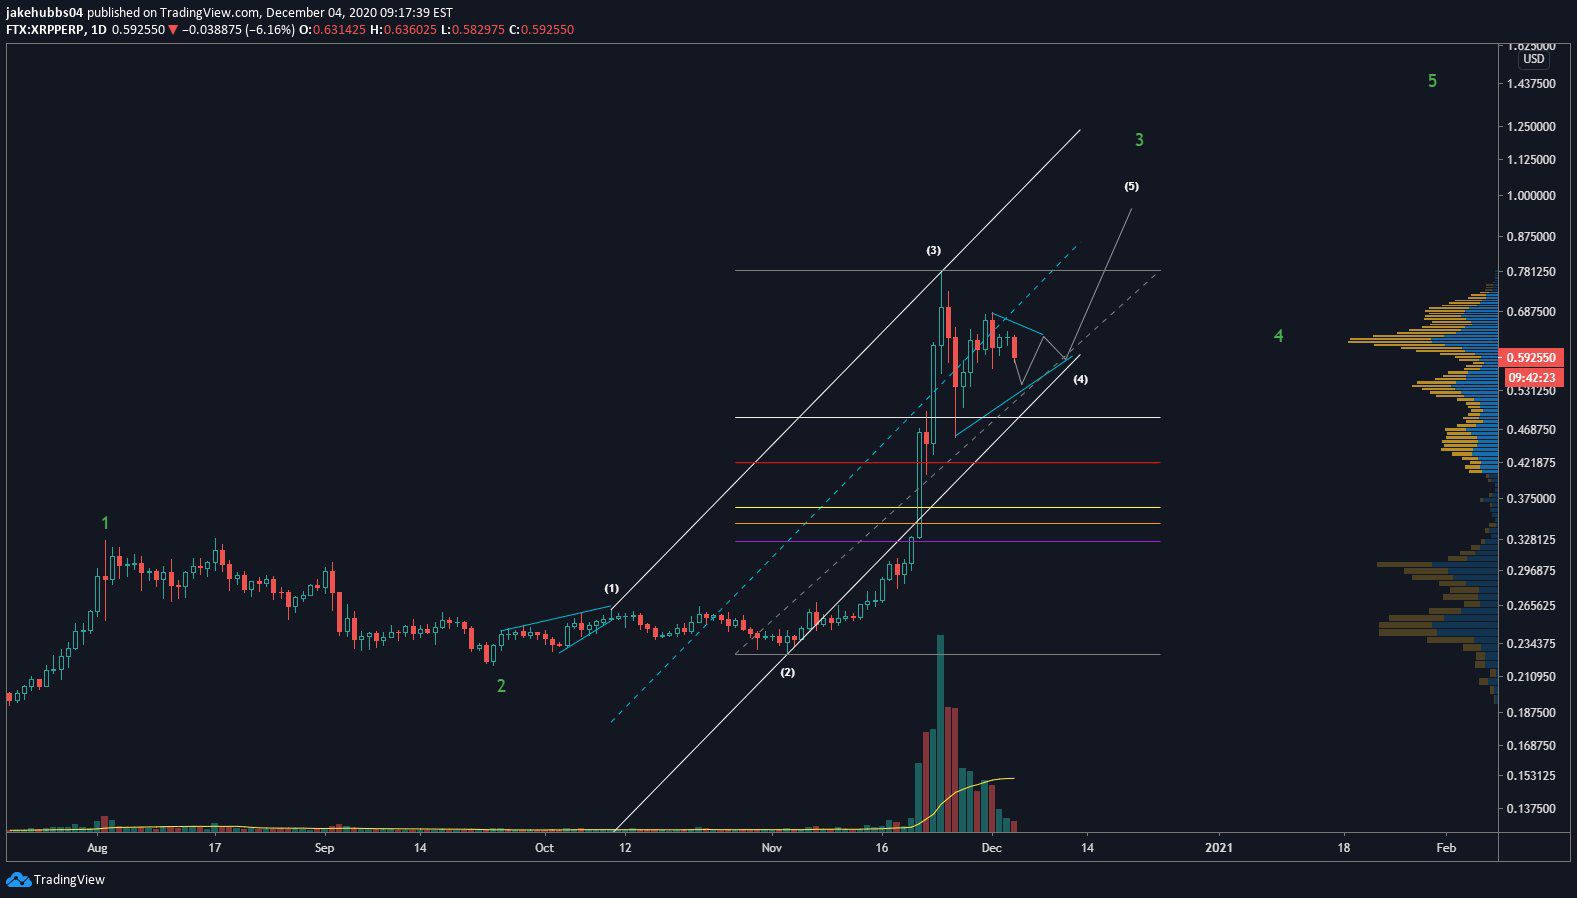
The wave count for XRP shows a possible 1-2/1-2 wave count, inside which XRP is currently in wave 3 (shown in white below) and has begun sub-wave 5 (orange).
The breakout from the parallel channel and subsequent re-test (green arrow) suggests that the upward movement is impulsive.
There are two main targets for the top of this move: at $0.89 (4.61 Fib extension of sub-wave 1) and $1.19 (length of sub-waves 1-3 projected to 4).
While the second target appears slightly more likely due to the proximity to the long-term resistance level outlined previously, we cannot accurately determine the target for the top before the move begins to develop.
Conclusion
To conclude, the XRP price should continue the upward movement outside of the symmetrical triangle and rally at least towards $0.89 and possibly $1.19.
Disclaimer: Cryptocurrency trading carries a high level of risk and may not be suitable for all investors. The views expressed in this article do not reflect those of BeInCrypto.