The Bitcoin Dominance Rate (BTCD) has been struggling to gain a footing since it dropped sharply on Nov. 21-24.
The rate is likely to break down from its short-term pattern and move towards the support levels outlined below.
BTCD Gets Rejected and Falls
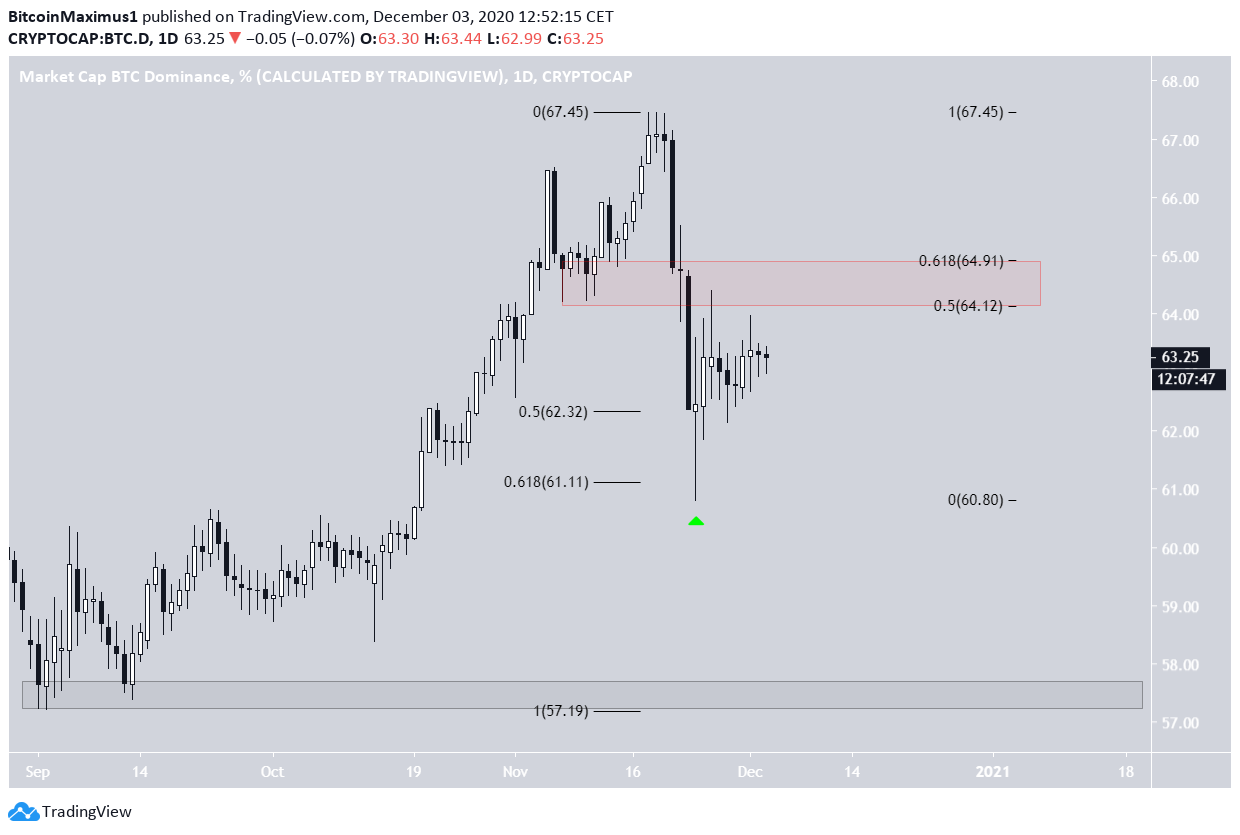
BTCD reached a high of 67.45% on Nov. 20 but dropped sharply immediately afterward.
The decline was swift and BTCD reached a low of 60.80% on Nov. 24. The low coincided with the 0.618 Fib retracement level of the entire upward move and left a long lower wick in its wake before BTCD moved upwards.
Despite the rally, BTCD has failed to move above the 0.5 – 0.618 Fib resistance area between 64 – 65%, which is a common level for corrections to end.
If BTCD fails to clear the resistance area and falls, the closest support area would be at 57%.
BTCD Future Movement
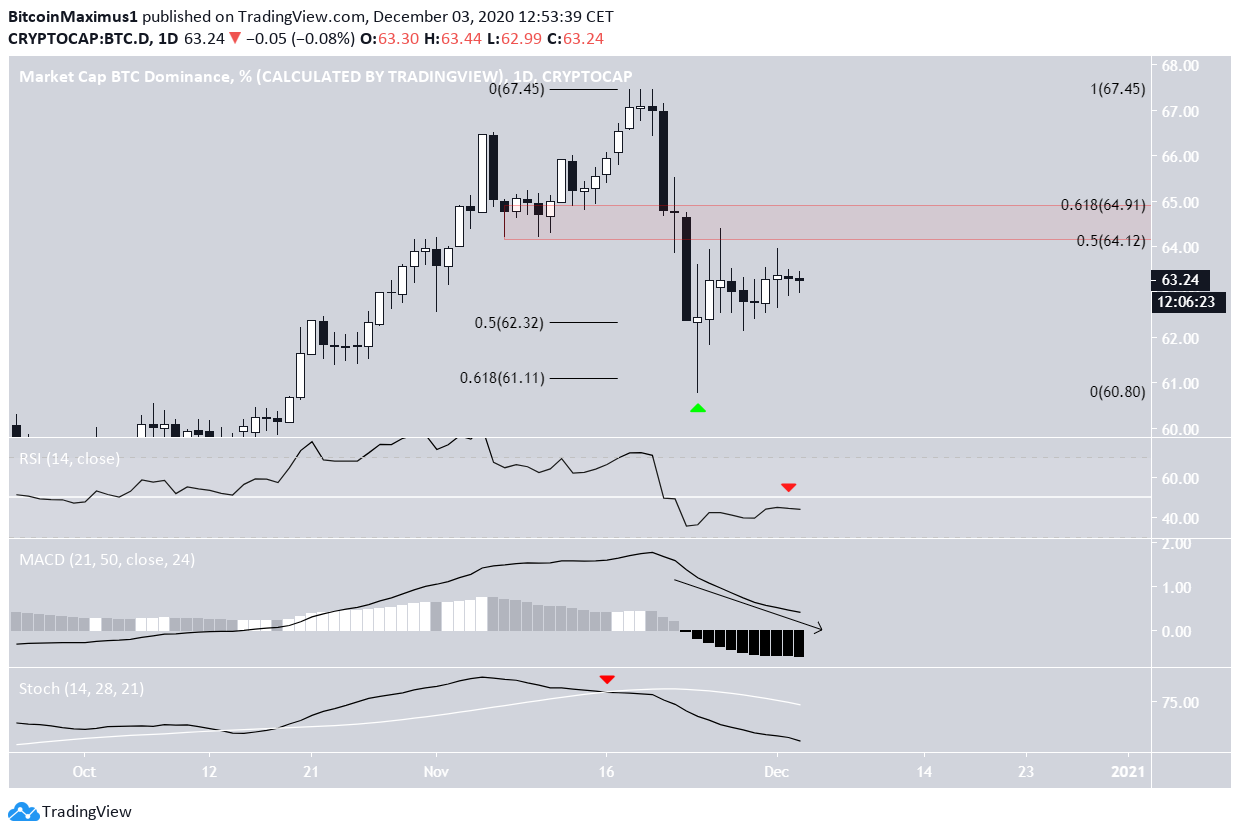
Technical indicators support the possibility of a continued decline.
The RSI is below 50, the MACD is decreasing and has almost crossed below 0, and the Stochastic Oscillator is moving downwards after previously making a bearish cross.
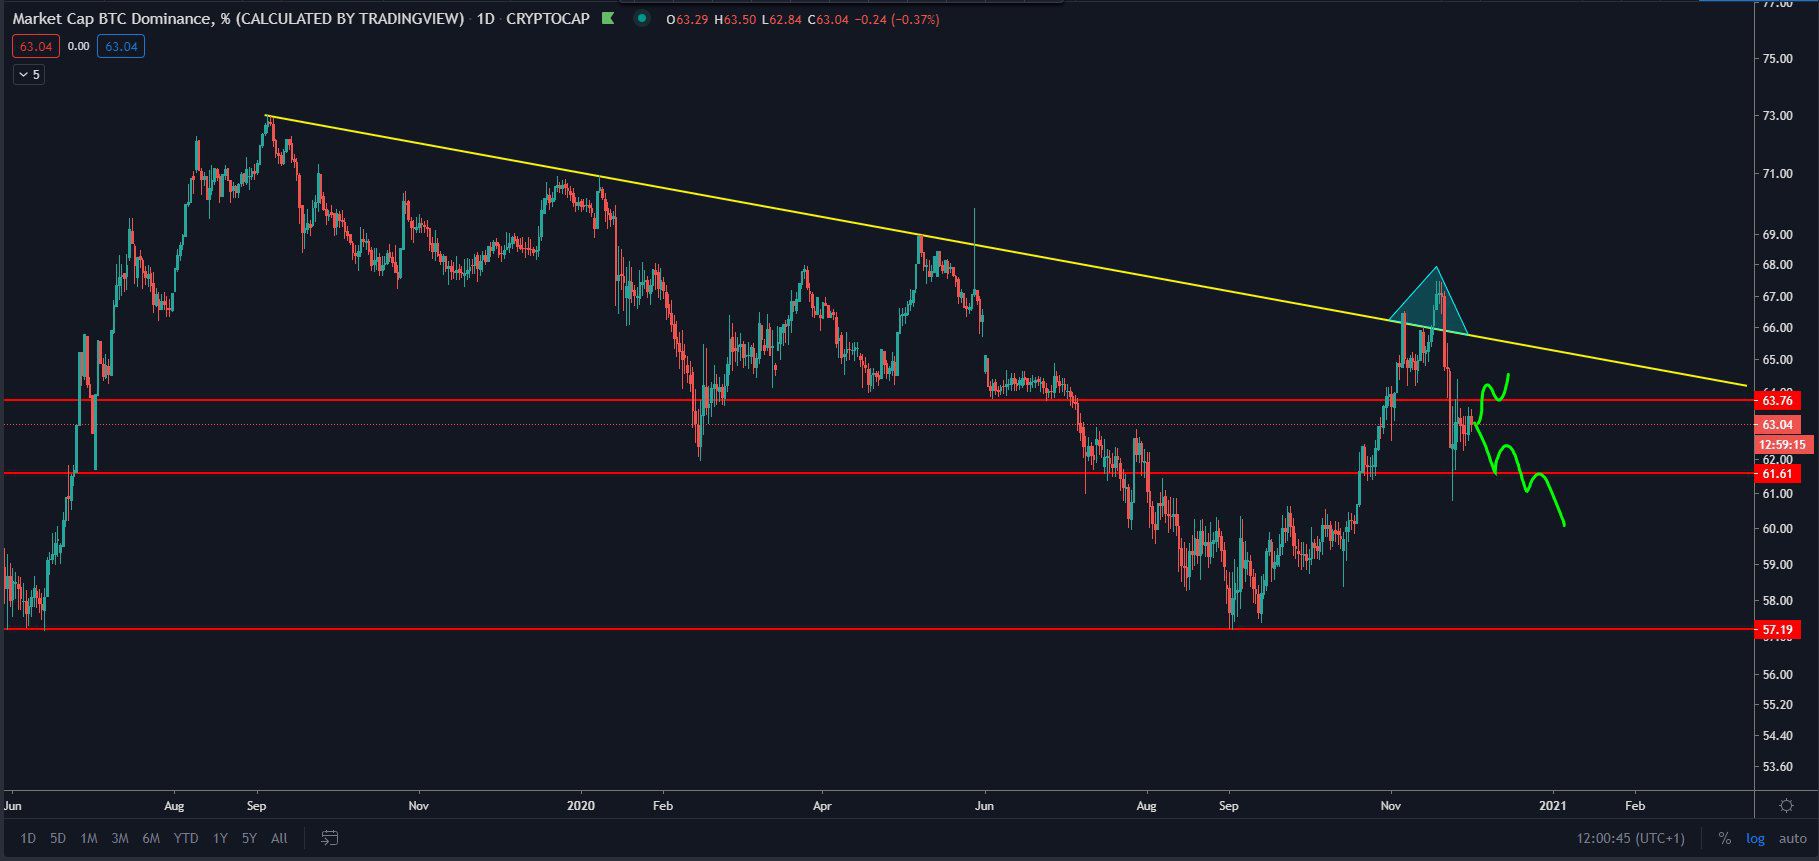
Cryptocurrency trader @Daancrypto outlined a BTC dominance chart, stating that whether the rate breaks out above 63% or falls below 61% will crucially determine the direction of the future trend.
Both areas coincide with those we have outlined. Due to the bearish readings from indicators, a breakdown seems the more likely option.
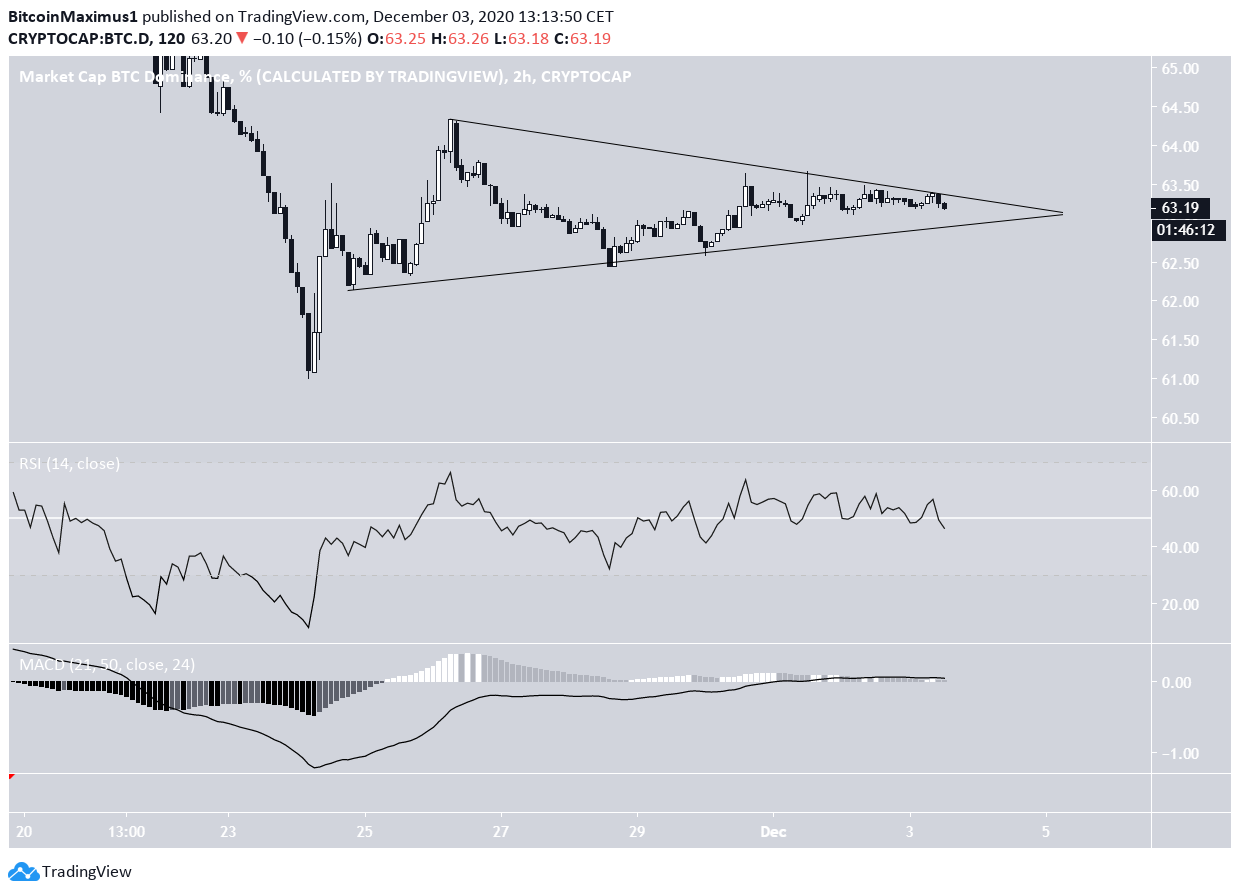
Once BTCD breaks down from the current symmetrical triangle, the rate of decline is likely to accelerate.
On the other hand, a breakout would cause another retest of the 0.5 – 0.618 Fib resistance before a possible drop.
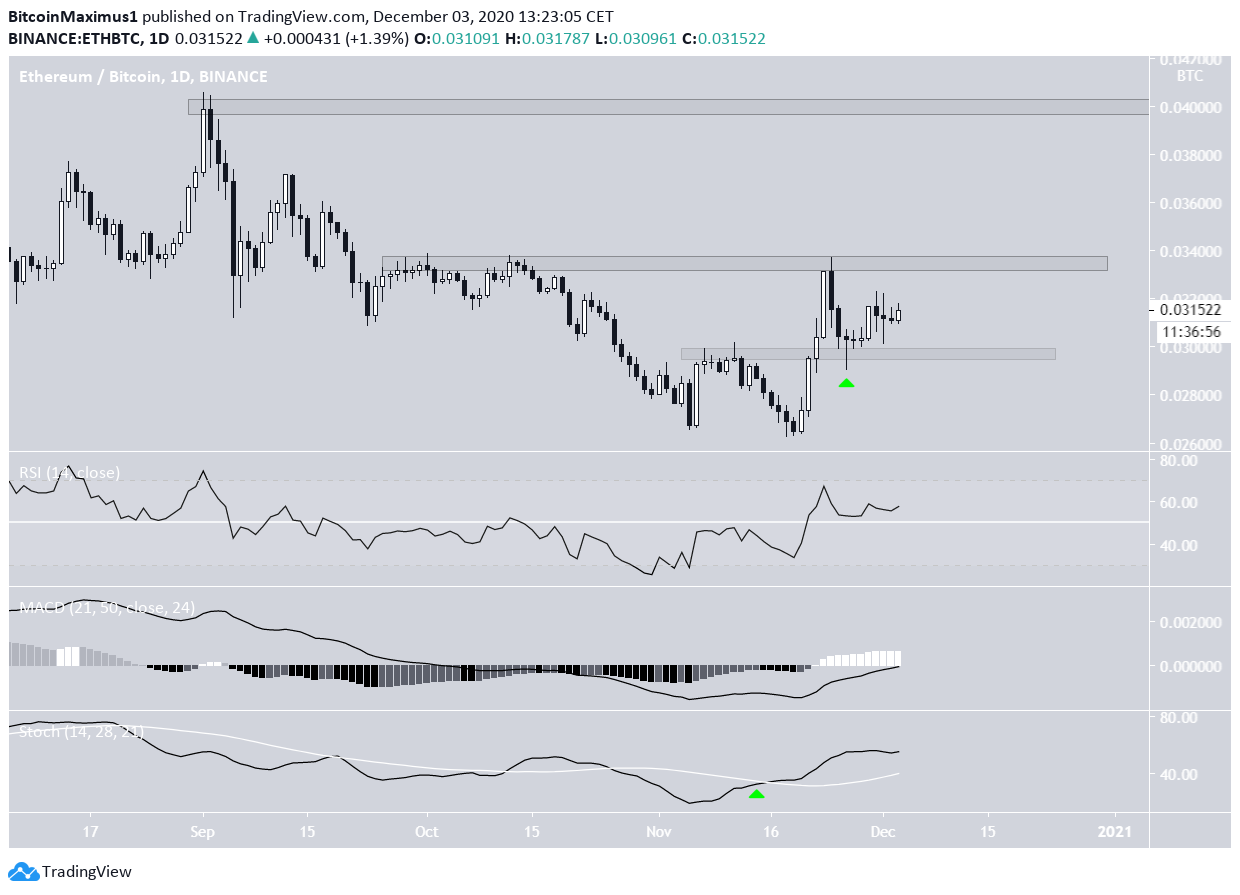
ETH/BTC
Since Ethereum (ETH) is the largest altcoin ranked by market capitalization, the movement of the ETH/BTC pair is a good predictor of BTCD movements.
ETH/BTC has been moving upwards since it reached a low of ฿0.026 on Nov. 18.
The price has retested the ฿0.0295 area as support and is moving upwards towards the next resistance at ฿0.033. A breakout would take ETH/BTC towards ฿0.04.
Technical indicators on the daily time-frame are bullish and support the possibility of this breakout, which would also fit with the projected decline for BTCD.
Conclusion
To conclude, BTCD is likely to fall from the current resistance area and eventually drop towards 57%.
On the other hand, the ETH/BTC pair could break out soon and move towards the next resistance area at ฿0.034.
Disclaimer: Cryptocurrency trading carries a high level of risk and may not be suitable for all investors. The views expressed in this article do not reflect those of BeInCrypto