Yearn Finance’s governance token YFI continued its winning spree entering the Thursday session as its price maintained its weekly gains of about 30 percent.
The YFI/USD exchange rate surged in the early European session, hitting $31,884 before turning lower due to profit-taking sentiment. That marked the second time in the previous 24 hours that witnessed the pair attempting to break above the $30,000-level.
Nevertheless, YFI appeared oversold after rallying almost parabolically from its quarter low of $7,015. That amounted to a downside correction — or consolidation unless the trend neutralizes to provide traders a stable buying level.
Looking from the technical perspective, YFI found itself catering to two separate bias indicators: the Head and Shoulder pattern, which is bearish, and the Ascending Triangle pattern, which is bullish. Here is a detailed outlook.
The Bearish YFI
The chart below shows YFI on the cusp of completing a Head and Shoulder pattern.

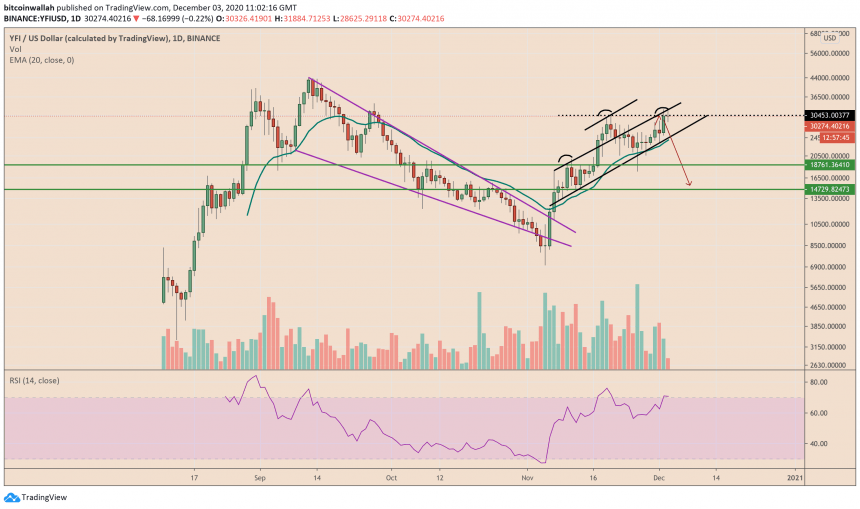
Yearn Finance's H&S Pattern in an uptrend. Source: YFIUSD on TradingView.com
In retrospect, the H&S chart formation appears when an asset forms three peaks consecutively on baseline support, with the middle being the highest than the other two that are of almost the same height. Traders interpret H&S as a bullish-to-bearish reversal pattern, pointing that the running uptrend is coming to exhaustion.
YFI has just formed the right and final shoulder (or peak). Technically, the cryptocurrency should follow up with a pullback towards the baseline (the longest black trendline). While that would make an H&S pattern, it would take another bearish breakdown below the baseline to confirm its whole.
Should it happen, the YFI/USD risks falling by as much as the length of the highest peak. It is roughly $10,000-12,000 long, which puts the pair en route to at least $20,000 upon an H&S breakdown.
The Bullish Outlook
There is also the possibility of YFI not pulling back from its so-called right shoulder’s peak towards the H&S breakdown target. Instead, the cryptocurrency could keep testing the $30,000-resistance level while receiving support from the H&S baseline, which would now be Ascending Trendline support.
Such a case would prompt YFI to form an Ascending Triangle pattern — a bullish one. Should it happen, the cryptocurrency would attempt a breakout above the $30,000-level. Once it happens, its upside target would shift to the level that sits near $50,000.
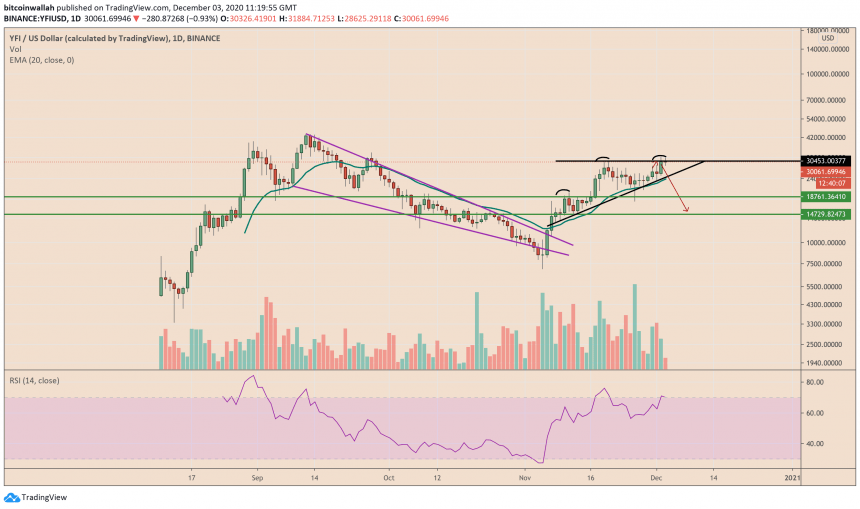
Yearn Finance's Ascending Triangle formation. Source: YFIUSD on TradingView.com
The technical bullish triangle’s technical breakout target is as much as the maximum distance between its two trendlines. That is about $20,000.