- The Cardano price analysis is bullish.
- Resistance for ADA/USD is present at $1.195.
- Support is present for ADA at $1.110.
The Cardano price analysis shows the bulls continue to rule the market and have brought up the price to the $1.152 range today. The price function is being constantly dominated by the bullish side, and today the price has gone up once again. A further increase in price can be expected in the upcoming week as the price has constantly been covering range upwards.
ADA/USD 1-day price chart: ADA continue trading as an overbought asset
The 24-hour price chart for Cardano price analysis shows the price is going up once again after the bulls managed to secure grounds on the Candlestick chart. The trending line in the 1-day price chart is continuously inclining, indicating that an uptrend has been following since 12th March after the coin got support at $0.785. Further increase in the upcoming days is to be expected, and the price might go higher than its current level, i.e., $1.152. The moving average is at a relatively stable position as it is trading at the $0.972 level.
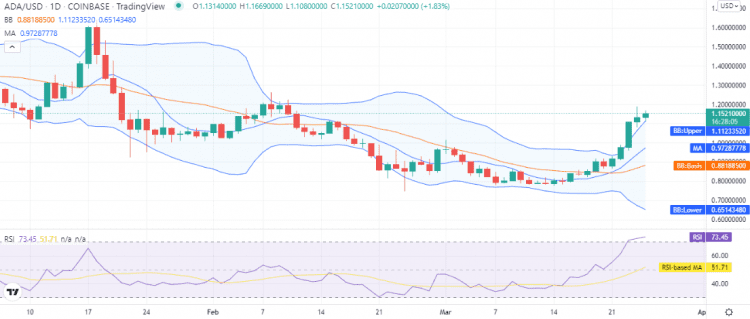
The volatility has increased tremendously during the last 24-hours as the Bollinger bands are expanding vastly. The upper value of the indicator is settled at the $1.112 mark representing the support for ADA price function as the price is trading above the upper band, and the lower value is present at the $0.651 mark.
The Relative Strength Index (RSI) entered the overbought zone on 23rd March and is continuing upside, reaching index 73 levels, indicating a healthy buying activity in the market.
Cardano price analysis: Recent developments and further technical indications
The 4-hour price chart for Cardano price analysis shows the coin recently got support at $1.130 level after a short correction that took place yesterday, and the price started to recover back as bulls rejected further downside. The price has been elevated up to $1.152, as the overall scenario is favorable for the bulls.
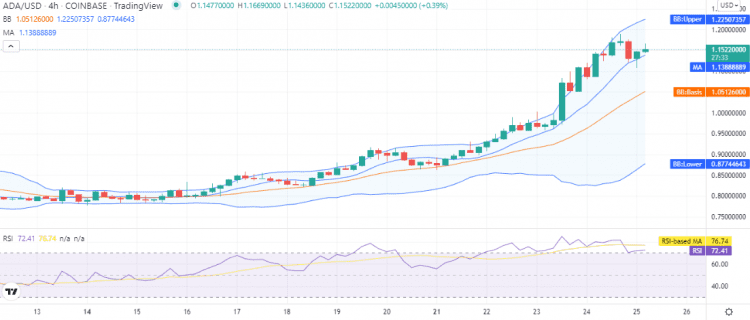
The SMA 20 curve is continuously trading above SMA 50, confirming a major bullish swing in price movement. The volatility has increased significantly, and now the upper Bollinger band value is at $1.225 while the lower one is at $0.877. The RSI score has slightly improved in the last 4-hours to index 72 after a small dip, but the RSI has remained in the overbought zone throughout, which hints at an aggressive bullish scenario.
Cardano price analysis conclusion
The price has undergone a further increase in the last 24-hours as it has been confirmed from the 1-day and 4-hours Cardano price analysis. The bulls are struggling to maintain their upper position on the price charts and have taken the price up to the $1.152 level. Further increase in the coin value is highly possible in the coming days. But for intraday trading, the ADA/USD may correct for a few hours before continuing further upside.
Disclaimer. The information provided is not trading advice. Cryptopolitan.com holds no liability for any investments made based on the information provided on this page. We strongly recommend independent research and/or consultation with a qualified professional before making any investment decisions.