The OmiseGo (OMG) price has been increasing since Nov 4, when it bounced at the support area of its current trading range.
While the price could increase in the short-term, it appears that OMG is in a longer-term downward trend.
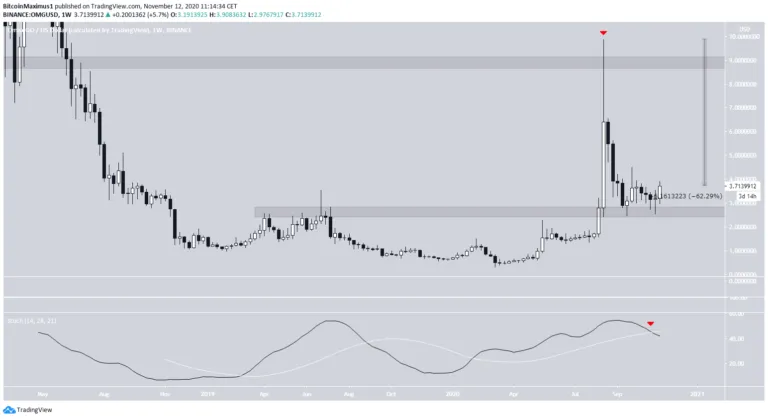
Long-Term Levels
OMG has been moving downward since it reached a high of $9.81 on Aug 21. The price was rejected sharply by the $9 resistance area and left a long upper wick in its wake. Since then, OMG has fallen by a full 62%.
At the time of writing, the price was trading slightly above the $2.80 long-term support area.
Despite this, the weekly Stochastic Oscillator has just made a bearish cross, a sign that the longer-term trend is likely still bearish.
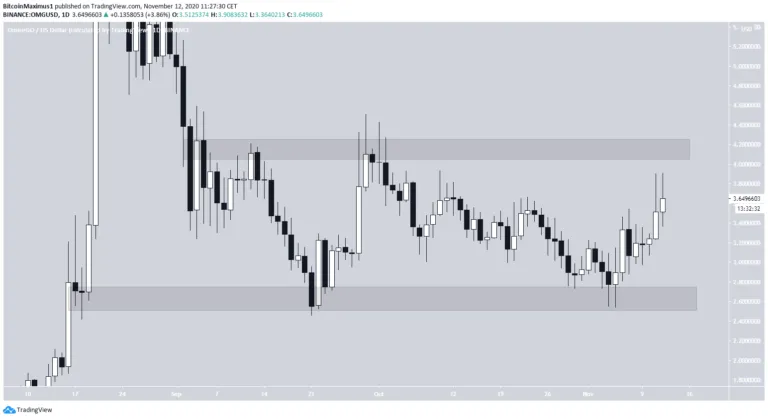
Current Trading Range
The daily time-frame shows that OMG has been trading in a range between $2.65 and $4.25, currently changing hands above the middle of the range.
The price reached the bottom of the range on Nov 4 and began to move upwards. OMG has almost reached the resistance area.
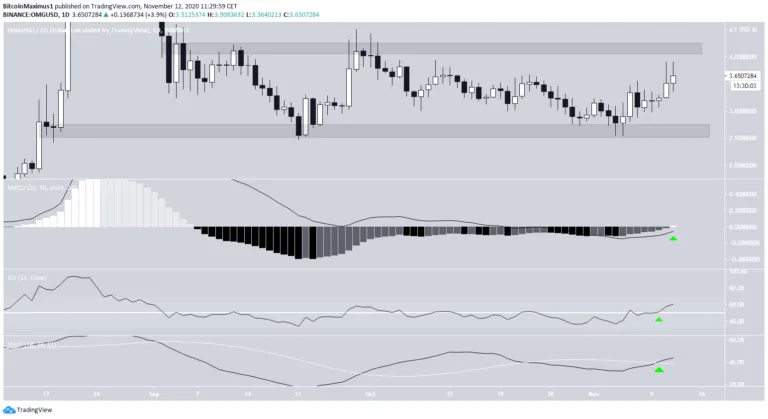
Technical indicators support this rally. All three of the MACD, RSI, and Stochastic Oscillator are moving upwards. The RSI has just crossed above 50 and the Stochastic Oscillator has made a bullish cross.
Therefore, the price should reach the $4.30 resistance area. However, due to the bearishness from the weekly chart, we cannot confidently state whether it will break out.
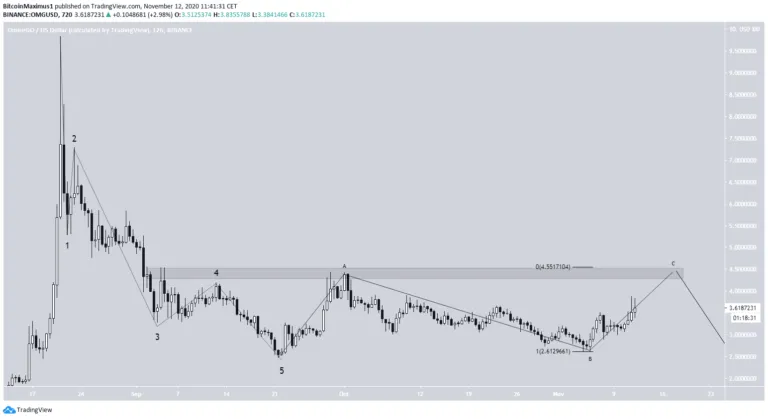
Wave Count
Cryptocurrency trader @CryptoTony_ outlined an OMG chart, stating that the price has a final push before dropping sharply.
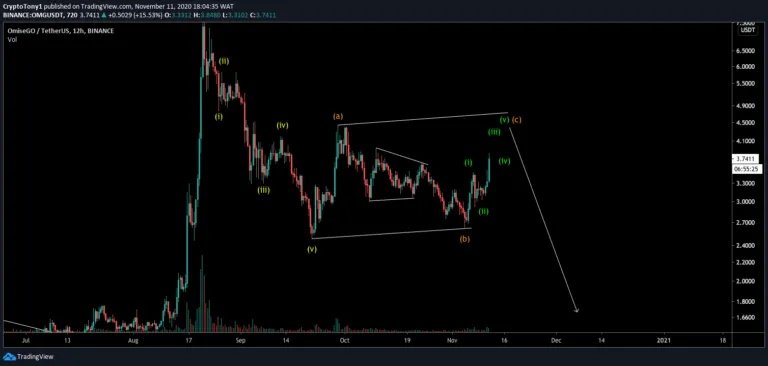
Measuring from the previous Aug 21 high, it appears that OMG has completed a bearish impulse (shown in black below) and begun an A-B-C corrective structure (black).
If waves A:C have a 1:1 ratio, which is common, the C wave could reach a high of $4.55, very close to the previously outlined resistance area.
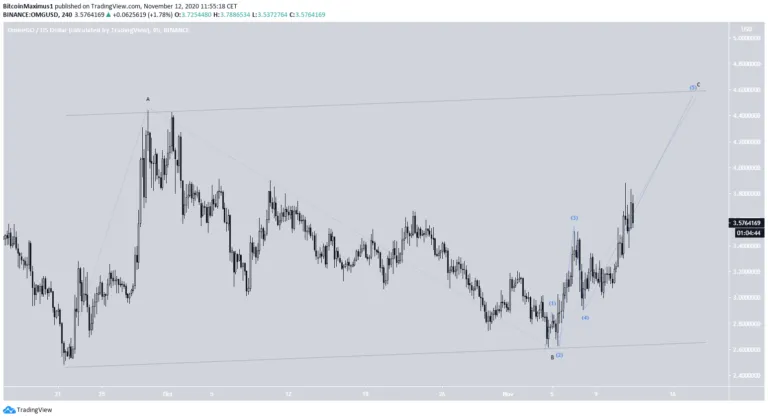
The shorter-term chart supports this, indicating that the price is in the fifth and final sub-wave (blue) which would complete the C wave.
Connecting the tops and bottoms of waves A and B using a parallel channel provides a very similar target near $4.60, aligning with the previously mentioned targets.
Conclusion
To conclude, while the OMG price is likely to increase in the short-term as it moves towards the resistance areas outlined, it’s likely that the price is still in a longer-term downward trend.
Disclaimer: Cryptocurrency trading carries a high level of risk and may not be suitable for all investors. The views expressed in this article do not reflect those of BeInCrypto