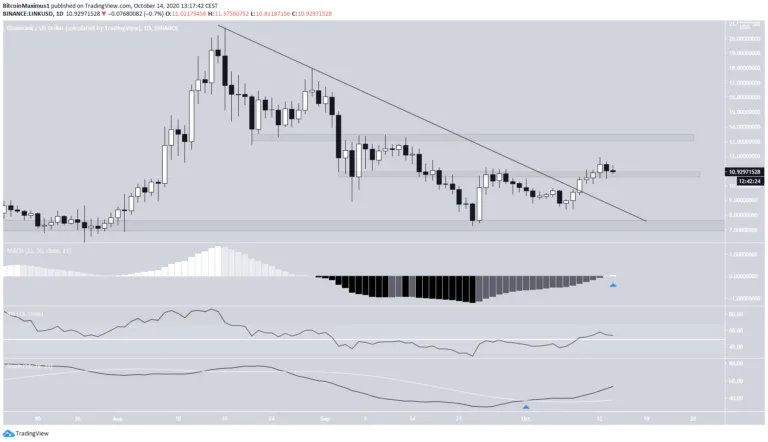
On Oct 8, the ChainLink (LINK) price broke out from a descending resistance line that had been in place for 52 days.
While a short-term decline could occur, the price should resume its upward move afterward.
LINK Breaks Out From Resistance
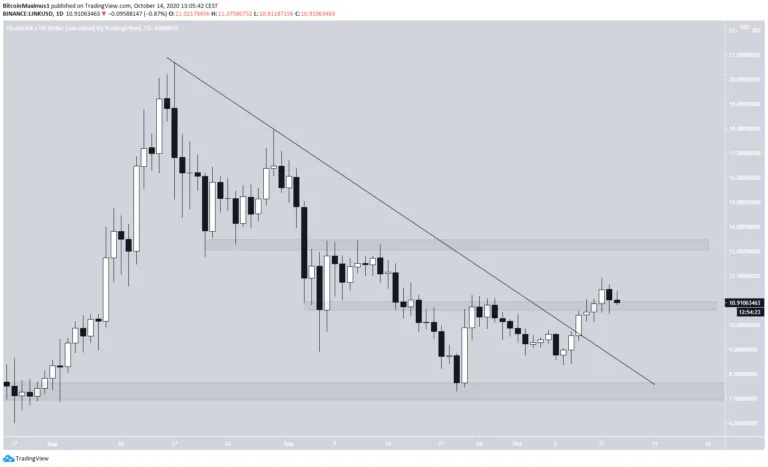
The LINK price has been moving downwards since it reached a high of $20.71 on Aug 17. The fall followed a descending resistance line and continued until the price reached a low of $7.28 on Sept 23. LINK has been increasing since.
On Oct 9, the price broke out from this resistance line and continued moving upwards until it broke out above the $9.80 resistance area a few days later. Currently, it is in the process of validating this area as support.
If the price continues to climb, the next resistance area would be found at $13.20. Conversely, a breakdown could take the price all the way down to $7.30.
Bullish Indicators
Technical indicators are bullish and support the previous rally towards resistance.
- The MACD has just crossed into positive territory.
- The RSI has crossed above 50.
- The Stochastic Oscillator has made a bullish cross.
Therefore, while the price is expected to move towards $13.20, a look at lower time-frames is required to determine how it will get there.
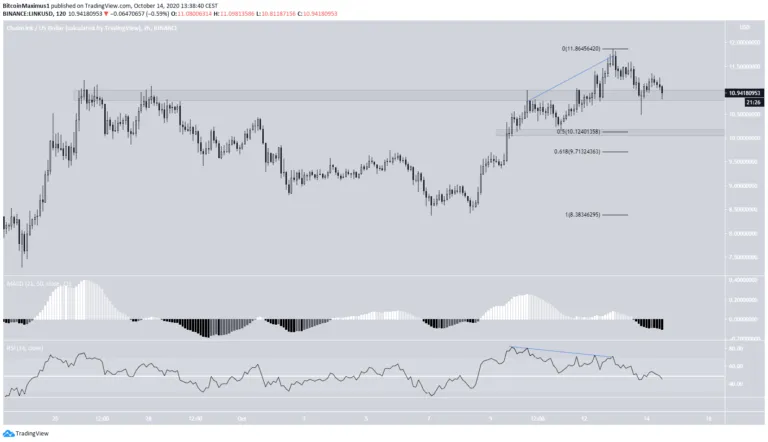
The 2-hour chart shows a breakout from and re-test of the $10.80 area, which previously rejected the price on Sept 26 – 28. The RSI formed bearish divergence, and the price fell afterward as a result, validating the $10.80 area as support and creating a long lower wick.
If the price manages to hold on above this level, it should increase towards $13.20, while a failure to do so would take the price towards the closest support area at $10.12.
If the price falls below the $10.80 area and fails to reclaim it afterward, it would be a major bearish development since the previous breakout would be considered a deviation above the range high. That would mean the price is likely to continue falling.
However, that doesn’t seem likely at the current time.
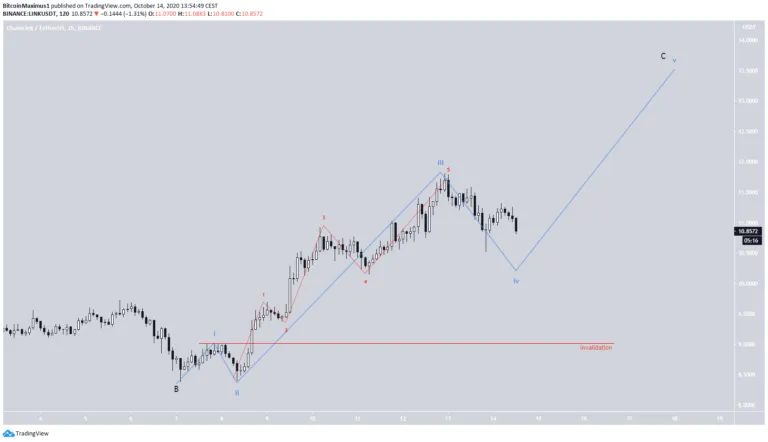
Wave Count
Cryptocurrency trader @TheEWguy outlined a LINK chart, in which he shows a completed bullish impulse and expects a pullback towards $9.50.
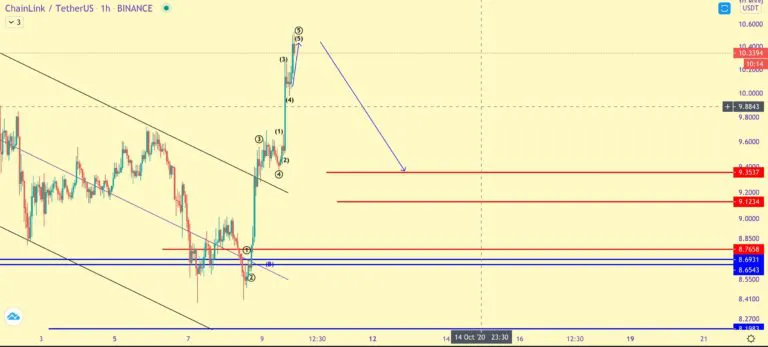
Since the Aug 17 high, the LINK price has possibly completed a bearish leading diagonal (shown in black below), which could have been the A wave of an A-B-C correction (in orange), currently in the B wave.
The B wave is also taking place inside an A-B-C structure (black), and the price is currently in the C wave.
The most likely targets for the top of the C wave are near $12.20 and $13.30 – $13.70, found by the Fib levels of the long and short-term wave A.
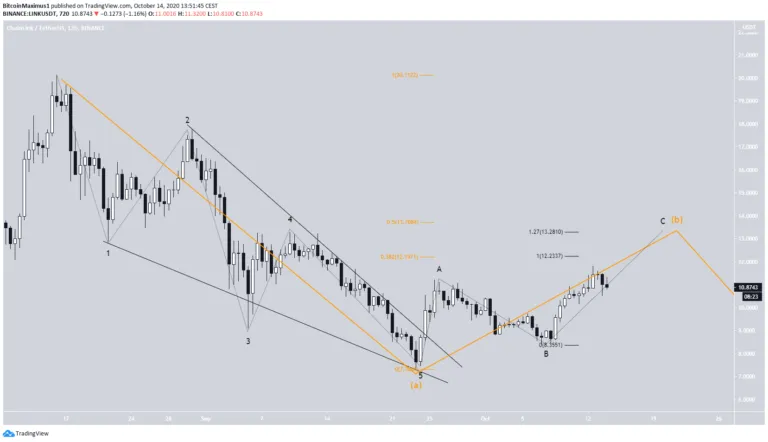
A closer look at the C wave reveals that the price has completed sub-waves 1 – 4 (shown in blue below) and is currently beginning wave 5.
Therefore, unless wave 5 is extremely short, the $13.30 – $13.70 area is more likely to act as the top.
To conclude, the LINK price should rally towards the closest resistance area before possibly falling to new lows.
Disclaimer: Cryptocurrency trading carries a high level of risk and may not be suitable for all investors. The views expressed in this article do not reflect those of BeInCrypto.