The Monero (XMR) price has regained all of its losses resulting from the Sept 2-4 crash and is currently making an attempt to break out above a major resistance level.
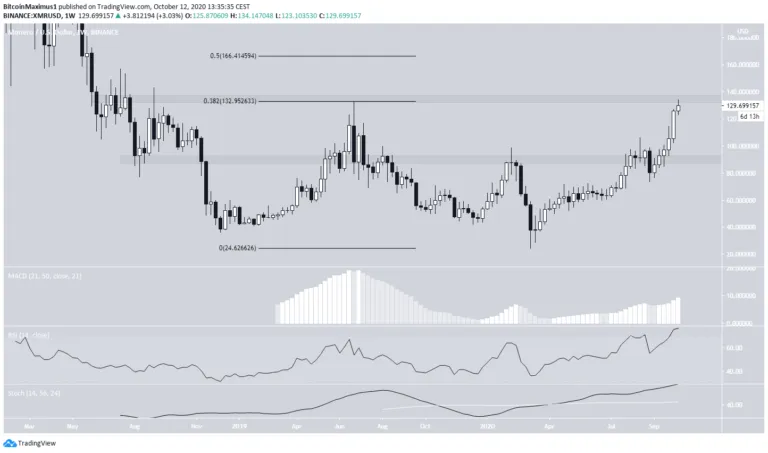
The XMR price is currently trading near an important resistance area found at $132. The area is the 0.382 Fib retracement level and a previous resistance area, above which the price has not traded since Aug 2018.
A successful breakout would likely take the price to $166, which is the 0.5 Fib level of the entire decrease and a previous support area.
XMR Technical Signals
Technical indicators are bullish as the MACD, RSI, and Stochastic Oscillator are all increasing. While the RSI is in overbought territory, it has not generated any type of bearish divergence yet.
On the other hand, a decrease would likely take the price to the closest long-term support area at $90. At the current time, this scenario seems unlikely.
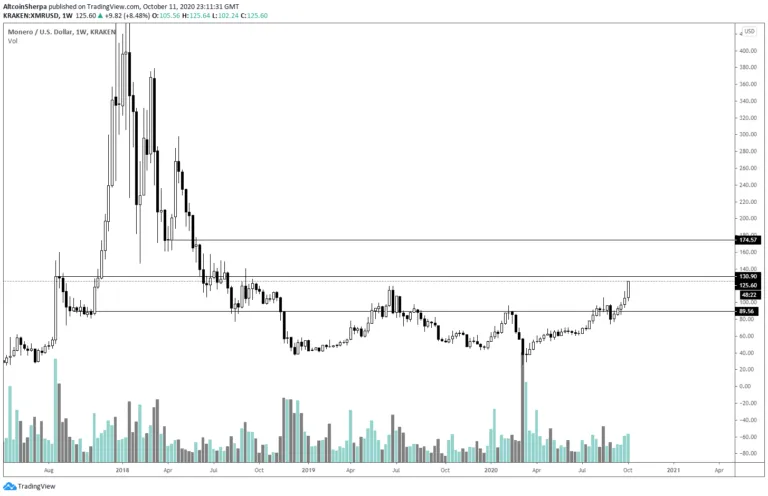
Cryptocurrency trader @Altcoinsherpa outlined an XMR chart, stating that the price could increase all the way to $175. While the level is slightly above the resistance area we have outlined, it is close enough to create some confluence.
No Weakness Yet
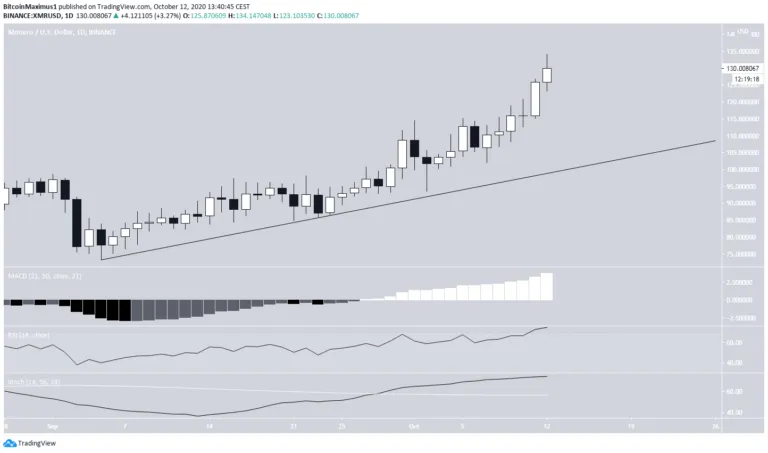
The six-hour chart shows that the price has been possibly following an ascending support line since it reached a low on Sept 4.
Similar to the weekly chart, there is no weakness in technical indicators, even though the RSI is overbought.
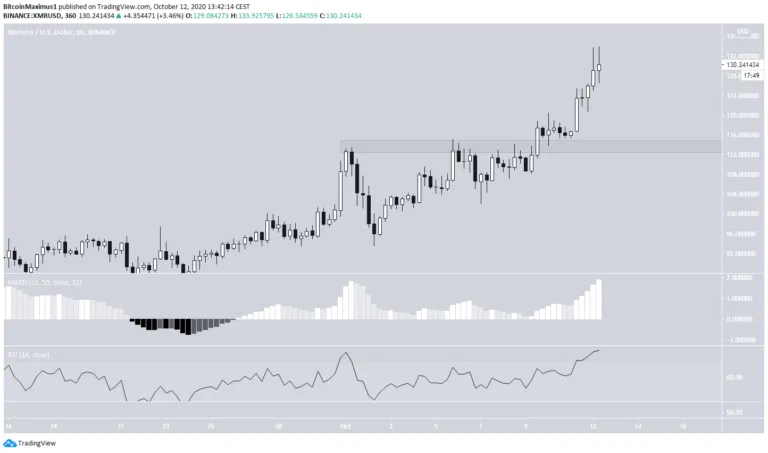
The two-hour chart does not show any weaknesses either, even though the rally has started to become parabolic.
If the price were to decrease, there is minor support near $113. However, there are no signs that the price will do so just yet.
As it stands, the most likely scenario is an eventual breakout above the $135 resistance area followed up by an increase towards $165.
XMR/BTC
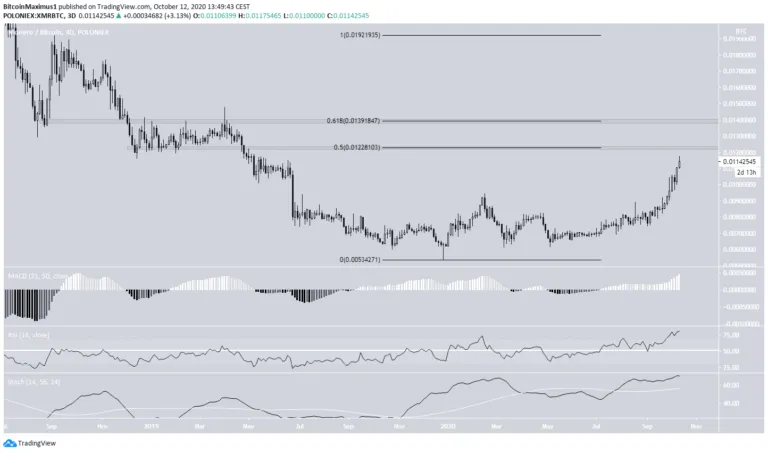
The XMR/BTC pair shows a similar movement to its USD counterpart, with the only difference being that the price has not yet reached the main resistance area found at ₿0.0122.
If XMR is successful in breaking out above this area, the next resistance would be found at ₿0.0139.
Technical indicators are almost identical to XMR/USD in that the MACD, RSI, and Stochastic Oscillator are increasing, with the RSI already in overbought territory.
The price is expected to reach the ₿0.0122 area and possibly break out to head towards ₿0.0139.
To conclude, the XMR price is expected to eventually break out from the current resistance area and head towards new highs.
Disclaimer: Cryptocurrency trading carries a high level of risk and may not be suitable for all investors. The views expressed in this article do not reflect those of BeInCrypto.