- NEO price analysis appears to be bullish.
- The strongest resistance is present at $24.
- The strongest support is present at $19.
NEO price analysis has revealed the cryptocurrency market to have bearish momentum with strong reversal possibilities as the price has broken the resistance. The NEO/USD price recently spiked to a huge incline on March 19, 2022, and The price went from $21 to $22 in no time. The next day the price continued an upward movement and went from $22 to $23.22 on the same day, On March 20, 2022.
NEO has been up 9.18% in the last 24-hours with a trading volume of $220,813,236. Neo currently ranks at #61, with a live market cap of $1,660,404,217.
NEO/USD 4-hour price analysis: Market broken
The NEO price analysis reveals the market’s volatility to be following an inclining trend, meaning that the price of NEO/USD is becoming more prone to experience variable change. The upper limit of the Bollinger’s band is present at $22, which serves as a support point for NEO. The lower limit of the Bollinger’s band is present at $19, which serves as another support point for NEO.
The NEO/USD price appears to be crossing over the upper limit of the Bollinger’s band, signifying a breakout happening in the market. However, this may imply that a reverse trend is probable in the coming days.
The NEO/USD price appears to be crossing over the curve of the Moving Average, signifying a bullish movement. The market trend has been bullish in the last couple of days, but since the market is broken, it seems the bullish era might come to an end.
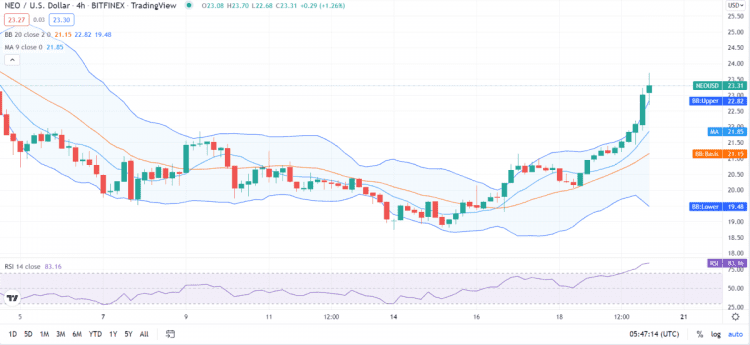
The Relative Strength Index (RSI) is 83, signifying a heavily inflated value for NEO. This means that the cryptocurrency falls in the overvaluation region. However, the RSI path can be seen following an upwards movement indicating that the cryptocurrency will experience increased value but may also dive deeper into the overbought category, which will result in a reverse trend.
NEO price analysis for 1-day: NEO/USD gains tremendous value
The NEO price analysis indicates that the market’s volatility appears to be following a dormant trend, meaning that the market shows no signal towards increasing or decreasing volatility. This will result in a more stable price for NEO. The upper limit of the Bollinger’s band is present at $24, which serves as the strongest resistance. The lower limit of the Bollinger’s band is present at $18, which serves as the strongest support.
The NEO/USD price appears to be crossing over the curve of the Moving Average, signifying a bullish movement. However, the price path can be seen following an upwards movement which indicates ab increasing market for the cryptocurrency.
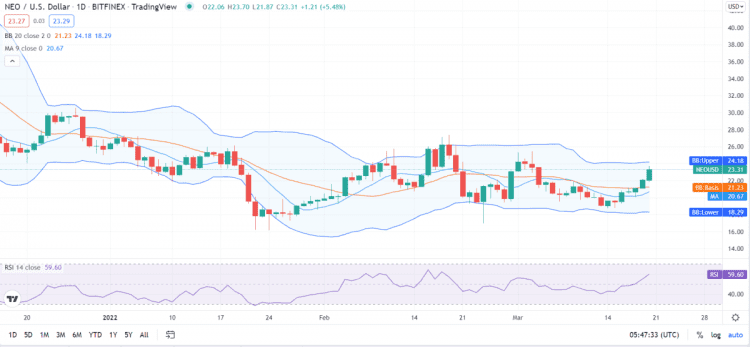
The Relative Strength Index (RSI) is 59, signifying a stable value for NEO. This means that the cryptocurrency falls in the upper neutral region. However, the RSI path can be seen following an upwards movement indicating that the cryptocurrency will experience increased value, which will result in complete inflation of the cryptocurrency.
NEO Price Analysis Conclusion
The conclusion of the NEO price analysis shows that the recognition made in the current behavior of the cryptocurrency indicates that it is following a wobbly upward trend with the possibility of going downhill very soon. NEO/USD climbed with fatigue at the $23 mark; the price reached $23.72 on March 20, 2022. The market shows strong signs of a reversal movement in the coming days.
Disclaimer. The information provided is not trading advice. Cryptopolitan.com holds no liability for any investments made based on the information provided on this page. We strongly recommend independent research and/or consultation with a qualified professional before making any investment decisions.