- Litecoin price analysis is bullish
- LTC/USD current resistance is seen at $112.82
- Support for LTC/USD prices is currently at $109.77
Today Litecoin price analysis shows a bullish trend. Litecoin’s price is currently trading at $112.82 after bulls managed to push prices from an intraday low of $111.01. The market capitalization currently stands at $7 billion, with LTC’s dominance rate at 3.6%. Litecoin prices are seeking support at $109.77 but the immediate resistance is seen at $112.82.
Bulls managed to take control of the market yesterday, pushing prices from an intraday low of $111.01 to a high of $118.68. The market capitalization increased by more than $1 billion in 24 hours, with Litecoin’s dominance rate rising to 3.8%. Despite the bullish trend, LTC/USD prices are still facing some resistance at $112.82.
Litecoin Price analysis on a 1-day price chart: LTC/USD bulls maintain the upward trend
On the 1-day price chart, Litecoin is in a clear uptrend as the coin is above both the 50-day and 20-day moving averages. The RSI indicator is currently at 63.80 and is not overbought or oversold. This indicates that there is still some room for Litecoin prices to move higher. Litecoin market vitality is seen to be high, with buyers currently in control of the market.
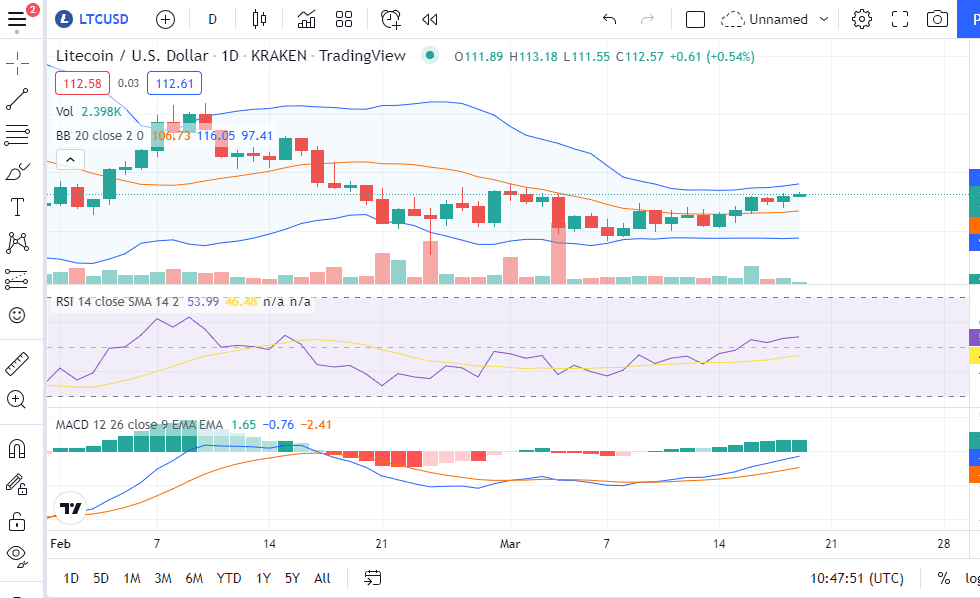
The EMAs are currently sloping upwards, indicating that the bullish trend is likely to continue. The moving averages are also well above the price of Litecoin, which shows that the bulls are currently in control. The MACD line is also above the signal line, indicating that the bullish momentum is still strong.
Litecoin Price analysis on a 4-hour price chart:Litecoin is likely to see a further rally shortly
On the 4-hour price chart, Litecoin is in a clear uptrend as the coin is trading above both the 50-day and 20-day moving averages. The RSI indicator is currently at 63.80 and is not overbought or oversold. This indicates that there is still some room for Litecoin prices to move higher.
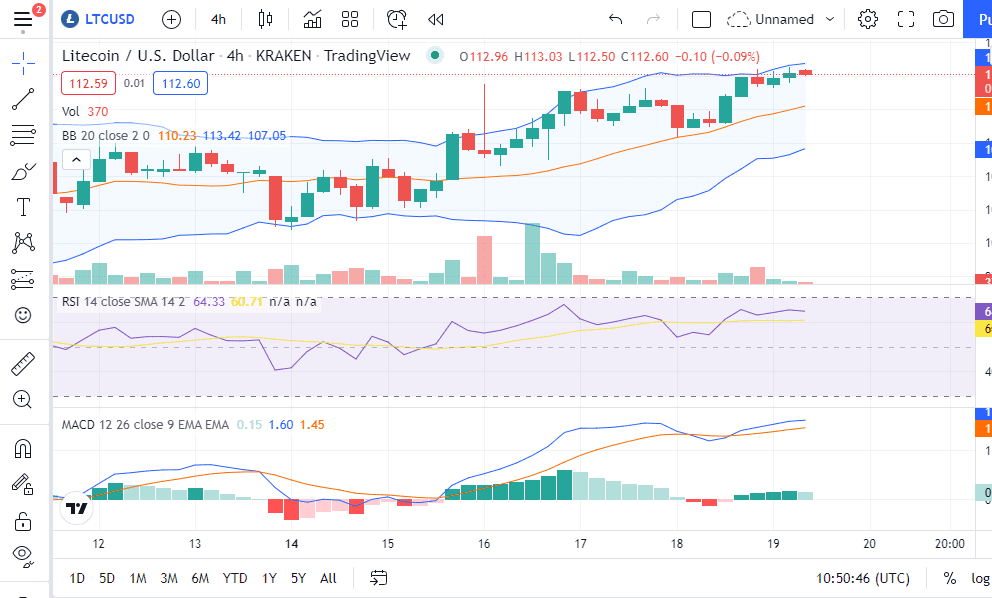
The moving averages are indicating a high buying pressure as they are well above the price of Litecoin. The MACD line is also above the signal line, indicating that the bullish momentum is still strong. Further technical indicators reveal that the bullish momentum is likely to persist in the near future.
Litecoin price analysis conclusion
Today’s Litecoin price analysis shows that bulls have taken control of the market and are pushing prices higher. Prices are currently trading at $112.82 and are facing some resistance at this level. However, the technical indicators reveal that the bullish trend is likely to continue in the near future.
Disclaimer. The information provided is not trading advice. Cryptopolitan.com holds no liability for any investments made based on the information provided on this page. We strongly recommend independent research and/or consultation with a qualified professional before making any investment decisions.