- The Cardano price analysis is bullish.
- Resistance for ADA/USD is present at $0.889.
- Support is present for ADA at $0.841.
The Cardano price analysis is bullish for today. Bulls have brought up the price to the $0.869 level, maintaining the bullish trend prevailing for the past week. Bulls flourished during the last few days as the price increased, and the bearish trend came to a halt. However, the last two days proved good for the coin, as the bullish momentum was quite strong.
ADA/USD 1-day price chart: Bullish momentum continues as DOT gains 3.96 percent overnight
The 1-day price chart for Cardano price analysis shows bulls are taking the price up to and seems successful in their attempts. Price is increasing gradually as bulls continue their lead. The ADA/USD pair traded between the range of $0.849-$0.881 today and is trading hands at $0.869 at the time of writing, reporting an increase of 3.96 percent in the coin’s value during the last 24 hours. The trading volume has also increased by 14.3 percent as well.
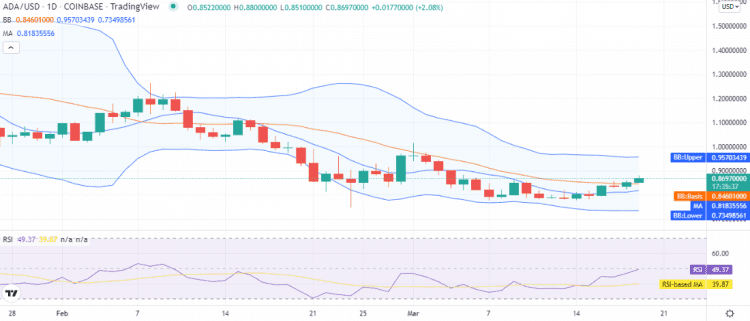
The volatility for ADA is comparatively high, as the Bollinger bands ends are maintaining the distance with their average line below the price level, which shows support for ADA price at $0.846. The Relative strength index (RSI) is near the center of the neutral zone at index 49, indicating the buying activity, and the moving average (MA) is at the $0.818 mark below the SMA 50 curve.
Cardano price analysis: Recent developments and further technical indications
The 4-hour price chart for Cardano price analysis shows price has been increasing every hour since the start of today’s trading session, as bulls are not sparing any chance. The price action has been upwards during the last four hours also as the price has reached $0.869 near the upper limit of the Bollinger bands.
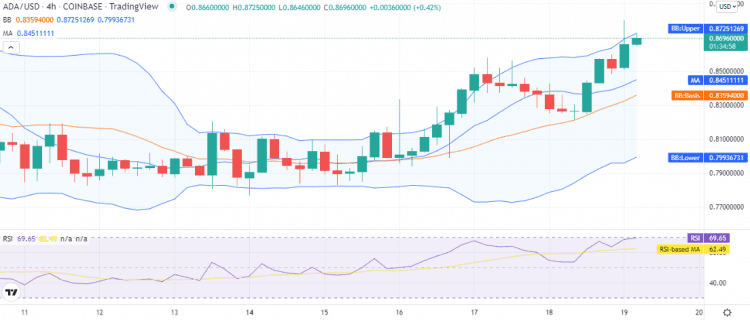
The volatility is high as the Bollinger bands continue to expand on the 4-hours chart with the upper Bollinger band at $0.872 and the lower band at $0.799, the mean average of Bollinger bands is forming at $0.835 below the SMA 20, and the moving average (MA) is trading below the price level in hourly charts at $0.845. The RSI is hovering at index 69 just at the border of the overbought zone, but the curve is flattening out, hinting at the opposition from the bearish side.
Cardano price analysis conclusion
From the daily basis and hourly Cardano price analysis and technical indications suggests a bullish momentum is on the go, but some correction might also take place as the RSI curve has flattened out during the past few hours. We expect the price may continue recovering if the support from the bullish side continues.
Disclaimer. The information provided is not trading advice. Cryptopolitan.com holds no liability for any investments made based on the information provided on this page. We strongly recommend independent research and/or consultation with a qualified professional before making any investment decisions.