- Shiba Inu price analysis shows a bearish trend
- A firm resistance has been established at $0.0000245
- SHIB is currently being traded at $0.00002284
Shiba Inu price analysis shows that SHIB prices opened the daily market chart at a value of $0.0000245 and have since dipped to lows of $0.00002184. A firm resistance has been established at this point at $0.0000245, however, it is unclear if this level will continue to hold as the market progresses. SHIB is being traded at this point at $0.00002184, with prices moving at a range of $0.00002178 to $0.00002268.
This slight dip comes after a period of consolidation around the $0.0000245 level, which appears to be acting as a firm resistance for the time being. Shiba Inu’s trading volume as well as the market capitalization has dropped overall by a significant margin. The 24-hour trading volume for SHIB is currently at $115,844, while the market capitalization has fallen to $2,393,618.
It is unclear what direction SHIB will take from here, but it seems likely that the $0.0000245 resistance level will continue to hold for the time being. If prices do break below this level, it is likely that SHIB will fall to $0.00002178 or lower. However, if the market can muster enough momentum, a push past $0.0000245 could see SHIB retesting $0.0000265 in the near future.
Shiba Inu price movement in the 1-day price chart: Bears have taken over the market
Shiba Inu price analysis on a 1-day price chart reveals the market has been bearish over the past day. A firm resistance has been established at $0.0000245, while SHIB is being traded at $0.00002184.This trade value is significantly lower than the opening trade of $0.0000245 and suggests that bears are in control of the market momentum.
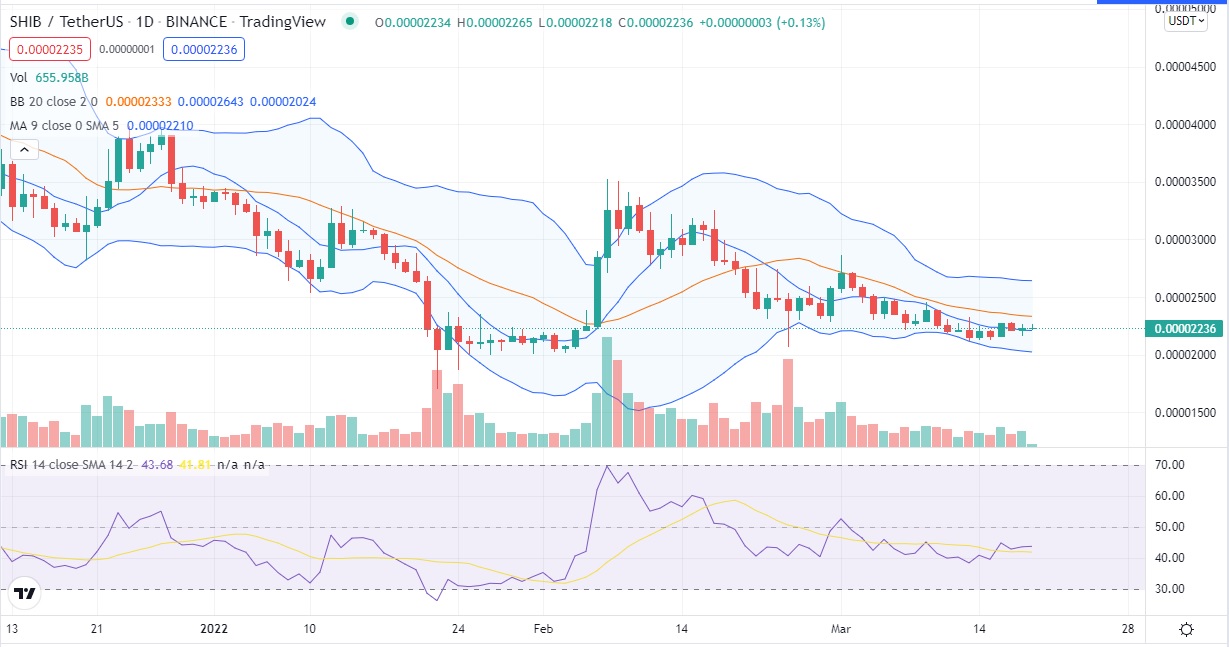
Bears have been able to counter any bullish trend that may arise as it is evident from the technical indicators, with the RSI currently at 36 and the MACD lines intersecting below the signal line. The Bollinger bands are indicating a high degree of volatility in the market as prices are seen to be fluctuating within a tight range.
Shiba Inu price action on a 4-hour price chart: SHIB prices are indecisive about their next move
Shiba Inu price analysis on a 4-hour timeframe reveals an indecisive market as prices fluctuate between $0.000022 and $0.000021. The market has been consolidating around the $0.0000215 mark for some time now, and it is unclear where prices will head next. The technical indicators on the 4-hour price chart show a similar story as the MACD is flatlining around the 0-line while the RSI hovers just below 50. The EMAs are also indicating a period of indecision as the short-term EMA is below the long-term EMA.
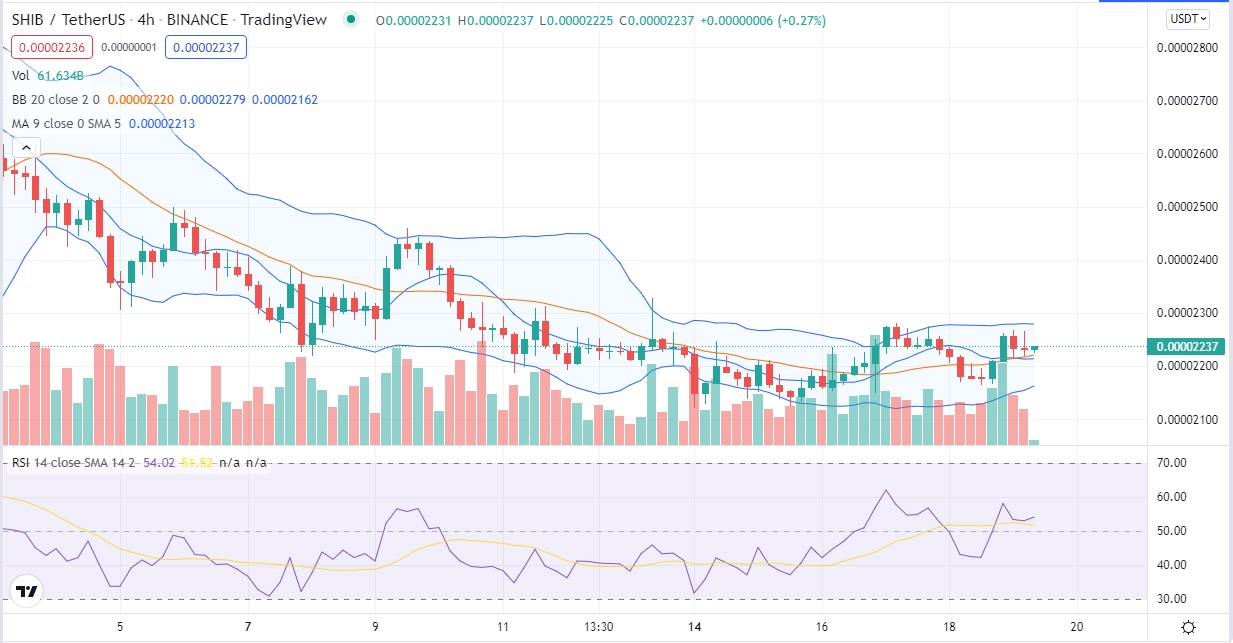
A breakout from this consolidation could see SHIB prices reaching $0.0000245 or higher, while a breakdown could see SHIB dropping to $0.000021 or lower.
Shiba Inu price analysis conclusion
Overall, it appears that the market is bearish at the moment with SHIB prices dipping to lows of $0.00002184. Bulls are expected to put up a fight at the $0.0000245 resistance level, but it is unclear if they will be successful in pushing prices higher. Bears are currently in control of the market momentum and a breakdown from the current consolidation could see SHIB falling to $0.000021 or lower.