- Polkadot price analysis is slightly bullish for today
- The key support level is present at $18.47
- DOT/USD is currently facing resistance at $19.0

Polkadot recent price analysis shows a decline of 2.93 in prices in the last 24 hours. At the moment of writing, DOT/USD prices are currently trading at $19.06. The Polkadot price is under pressure after a failed attempt to surge above the $19.00 level. With a bearish short-term bias, key support has been seen at $18.00 while the all-time resistance price is present at $21.00.
The cryptocurrency market has seen a roller coaster ride over the past few days, with prices spiking and then crashing hard in quick succession. DOT/USD is no different, as the price has been on a downtrend since it hit an all-time high of $19.85 on May 19. The price has retraced to $18.47 and is currently facing rejection at the $19.0 level. The total market capitalization stands at $359 million with a daily trading volume of $10 million. Polkadot prices have been moving at a range of $18.40 to $21.00 for the last 7 days as trading activity stabilizes.
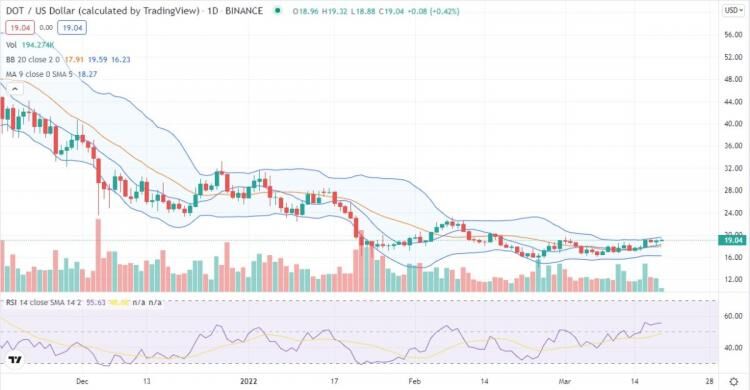
Polkadot price analysis in 1-day price chart: DOT/USD prices rejects the upward movement
Polkadot price analysis on a 1-day price chart shows DOT/USD prices have been on a slight decline in the last 24 hours. Prices have retraced to $18.47 after a failed attempt to surge past the $19.00 level. A bearish trend line is currently being formed with resistance at $19.00 and support at $18.50. The 50-day moving average has crossed above the 200-day moving average signaling a short-term bullish trend.
The MACD is in the process of making a bullish crossover and the RSI is at 50 indicating a neutral market condition. The hourly chart shows that prices are currently trading below the Ichimoku Cloud and it is likely that prices will continue to decline in the short term. Currently, the market is correcting from recent highs as bulls take a breather before the next push higher.
The technical Polkadot price analysis for DOT/USD shows a market that is in a bearish trend and is currently trading below the 50-day EMA. The RSI indicator has moved into oversold territory which suggests that a corrective rally may be seen in the short term. However, the key resistance levels remain at $19.00 and $21.00 which may limit any upside potential in prices. For now, it is best to remain patient and wait for a clear direction from the market before taking any trading positions after studying the Polkadot price analysis in detail.
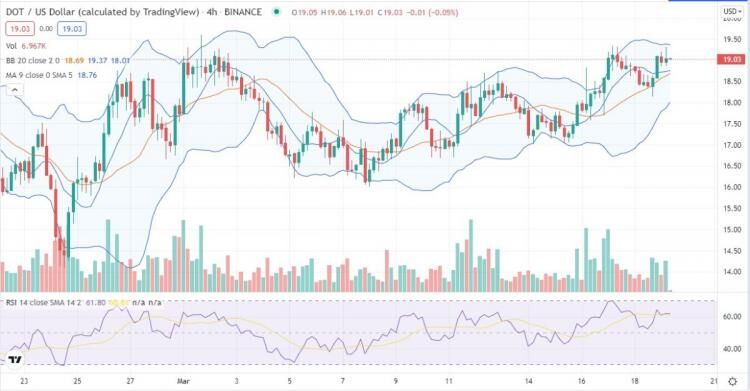
Polkadot price analysis on 4-hour chart: Prices form a descending triangle pattern
A look at the 4-hour chart for DOT/USD shows that prices have formed a descending triangle pattern. This is a bearish pattern that suggests that prices may continue to decline in the short term. The key support levels to watch are at $18.40 and $18.00 while resistance is seen at $19.00 and $19.40.
The MACD indicator is in the bearish territory while the RSI indicator is currently at 42 suggesting that prices may continue to decline in the short term. Overall, the technical picture for DOT/USD suggests that a further decline may be seen in prices in the short term as bulls struggle to push prices higher. The market volatility is however seen to be high which suggests that there may be some sharp price movements in either direction. The moving averages MA(50) and MA(200) are both sloping downwards which indicates a bearish trend.
Polkadot price analysis conclusion
The Polkadot price analysis shows that DOT/USD is currently under pressure after a failed attempt to break past the $19.00 resistance level. A bearish short-term trend is forming with key support at $18.00. The technical indicators are indicating that prices may continue to decline in the short term. However, the market volatility is high which suggests that there may be some sharp price movements in either direction.