Chainlink just set a record for the most bullish green daily candle since 2020 started. The 24-hour surge beat out any intraday rallies leading up to the asset’s current all-time high.
It also has kept a bull flag formation alive that could send Chainlink to $25 and another new price peak before the year is over. Here’s why technical analysis could indicate that the cryptocurrency will continue along higher.
Chainlink Chart Pattern Targets New ATH Before End of 2020
Chainlink, a crypto project focusing on decentralized oracles has taken the market by storm since its debut. The altcoin emerged out of the bear market and has never truly experienced an asset bubble to tarnish its reputation.
It has allowed this remarkable asset to keep on shining, and continue to set new highs year after year. It has also resulted in the cryptocurrency outperforming the rest of the space by a sizeable margin.
It has also help Chainlink rise the ranks of the crypto market top ten by market cap, and set an all-time high this year more than four times its previous peak.
And although Chainlink fell 60% from highs, its final 2020 peak may not even be put in yet. From the 60% fall on three-day LINKUSD price charts, a record-breaking rebound closed a bearish engulfing candle after bouncing at support.
The bounce also kept an extremely bullish chart pattern alive with a $25 target before the end of this year, pictured below.

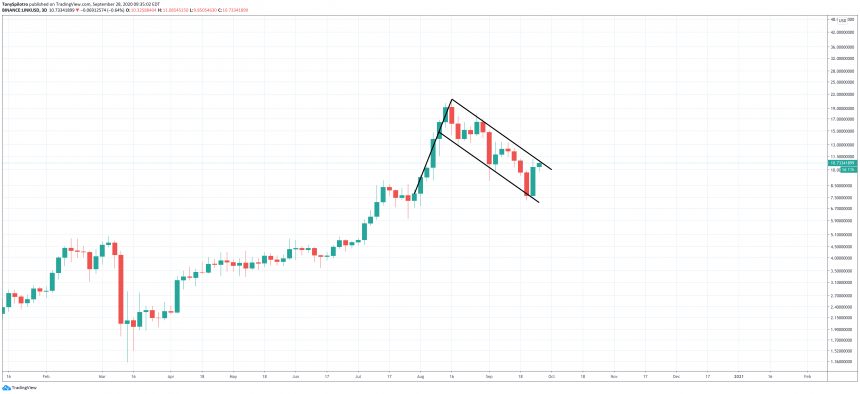
LINKUSD 3D Potential Bull Flag Chart Pattern | Source: TradingView
The Measure Rule: Bull Flag Breakout Aims For $25
The bullish chart pattern still holding strong is called a bull flag, and it consists of a large rise in price followed by downward-pointing consolidation.
The initial spike upward causes what is called a flag pole, surprising bearish investors by taking out stop losses and surging higher supported by volume. From there, price action settles down, consolidates, and even tilts down to tantalate bears salivating over the next push lower.
Instead of falling lower, however, just like Chainlink did recently, the asset bounces up from a sweep of lows towards the upper trend line. That’s when LINKUSD will meet previous horizontal support turned resistance, and attempt to break through higher.
Bull flag targets are taken by measuring the flag pole and applying it to the breakout point. The flag pole on the way up was an over 165% rally.
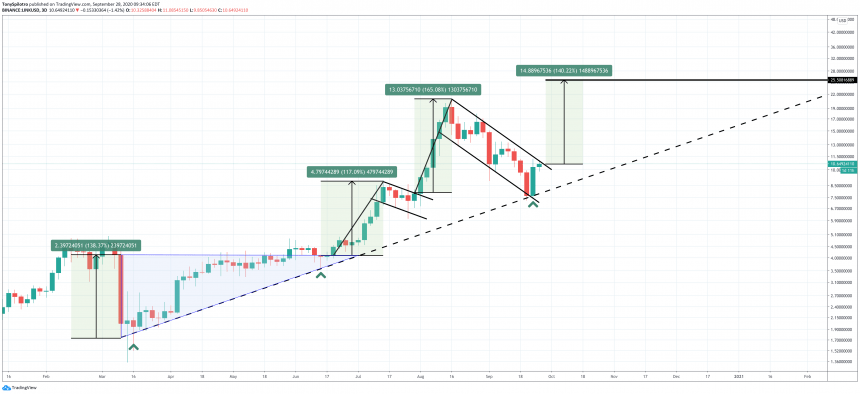
LINKUSD 3D Ascending Triangle and Two Bull Flags 2020 Review | Source: TradingView
And although another similar-sized rally could be next, the measure rule isn’t always 100% flawless. The previous bull flag that broke upward had far less consolidation and overall volatility, and it began with a 115% rise out of an ascending triangle.
According to the measure rule, that ascending triangle should have resulted in a roughly 136% ROI. Averaging out the three previous rallies, it gives us an estimate of a 140% potential climb toward $25, should the pattern break out to the upside.
Its also interesting to note, that the record-breaking bounce took place at an uptrend line stemming back from the bottom of the Black Thursday wick. A bounce from that trendline caused two bull flags worth of continuation.
With another bounce underway, we’ll soon find out if it was a dead cat bounce or a refuel before new 2020 all-time highs.