The pioneer cryptocurrency continues trending upward despite mounting uncertainty in the market. While data shows Bitcoin has more room to go up, different metrics suggest that a correction may come before it advances further.
Bitcoin Rises Steadily, Aiming for $11,400
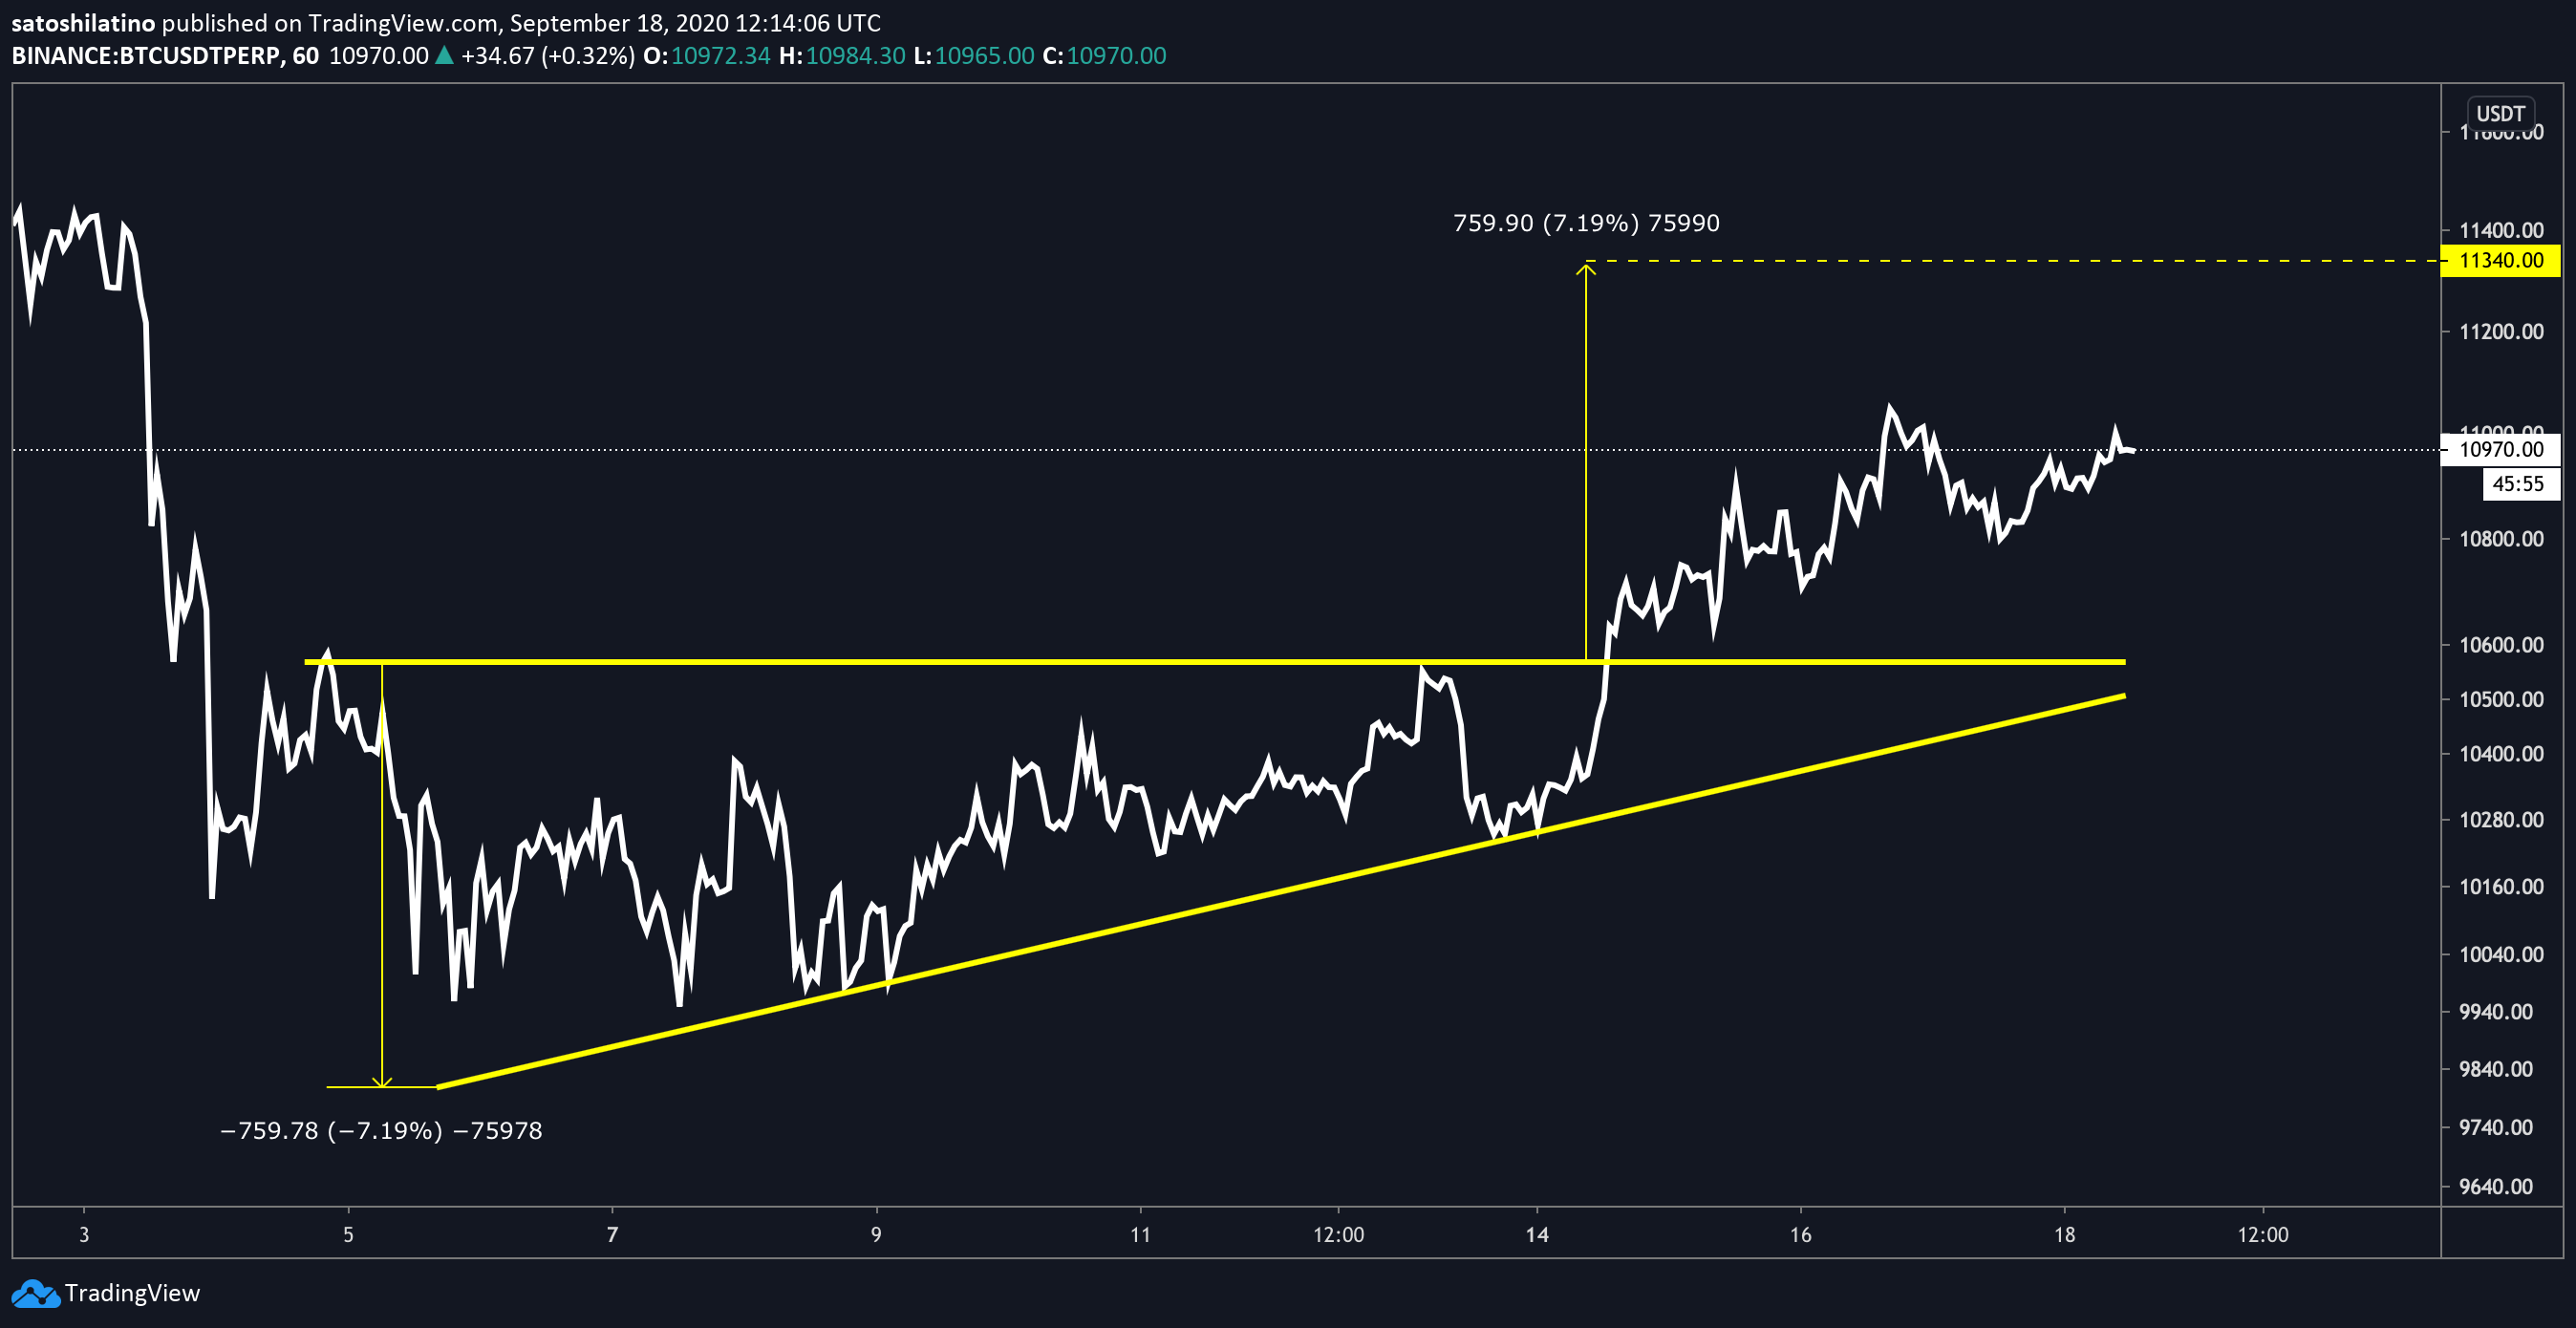
Bitcoin appears to have broken out of an ascending triangle that was forming on its 4-hour chart following the 19% drop seen at the beginning of September. Slicing through the x-axis of this consolidation pattern suggested that BTC was poised to surge over 7% to reach a target of $11,400.
Such a bullish target was determined by measuring the triangle’s highest points and adding that distance to the breakout point.
While prices have been steadily rising over the past few days, one particular on-chain metric indicates that nothing will prevent the flagship cryptocurrency from achieving its upside potential.
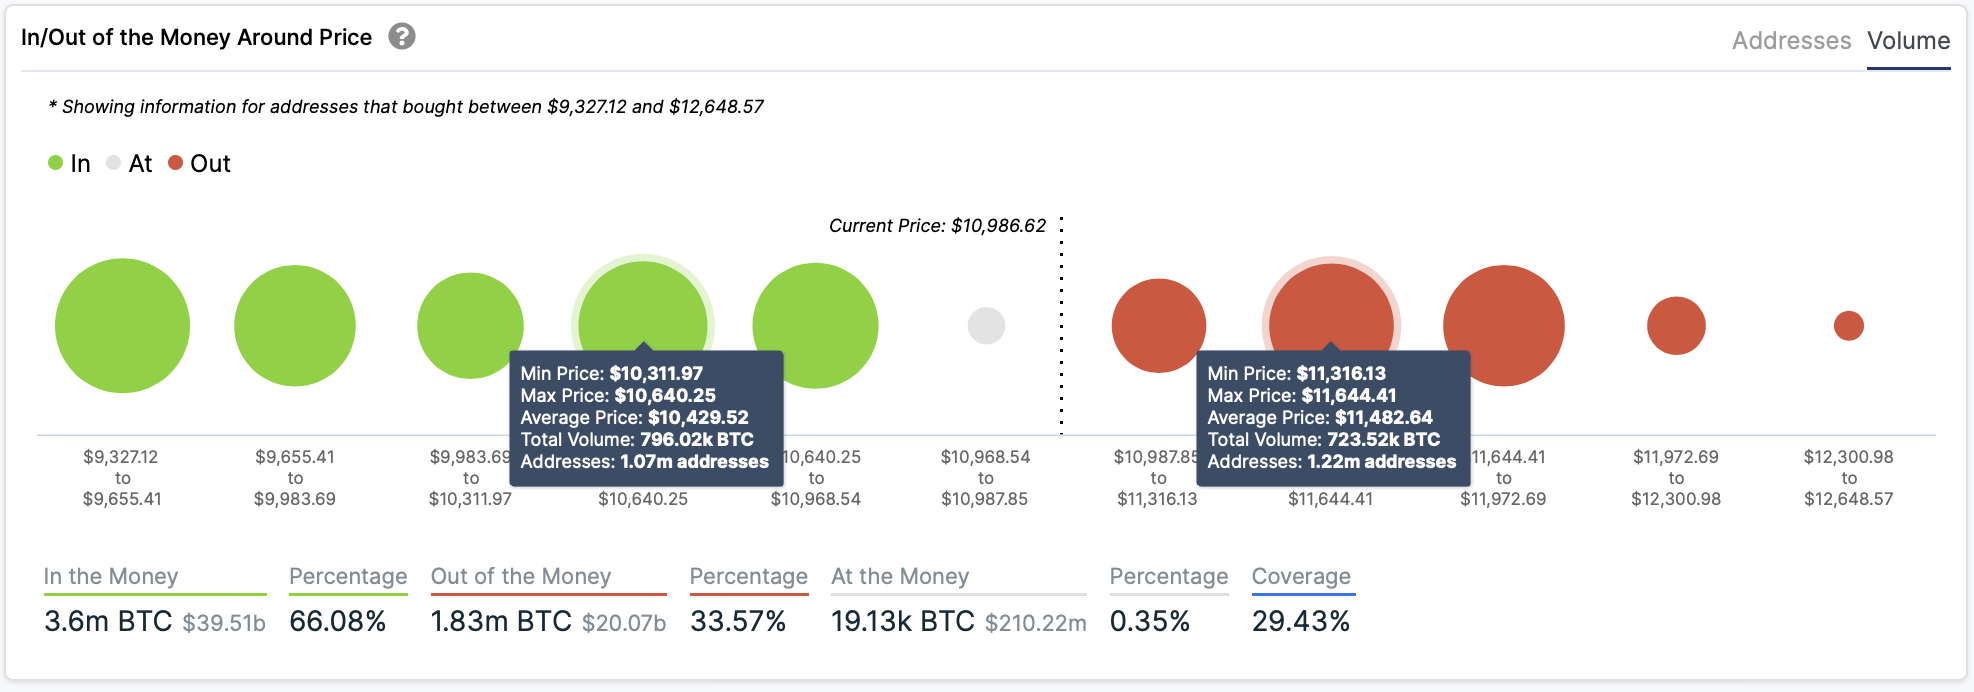
IntoTheBlock’s “In/Out of the Money Around Around Price” (IOMAP) model shows no significant supply barriers ahead that would obstruct a further advance towards $11,400. But moving past this hurdle will likely be difficult as 1.2 million addresses purchased over 720,000 BTC around this price level.
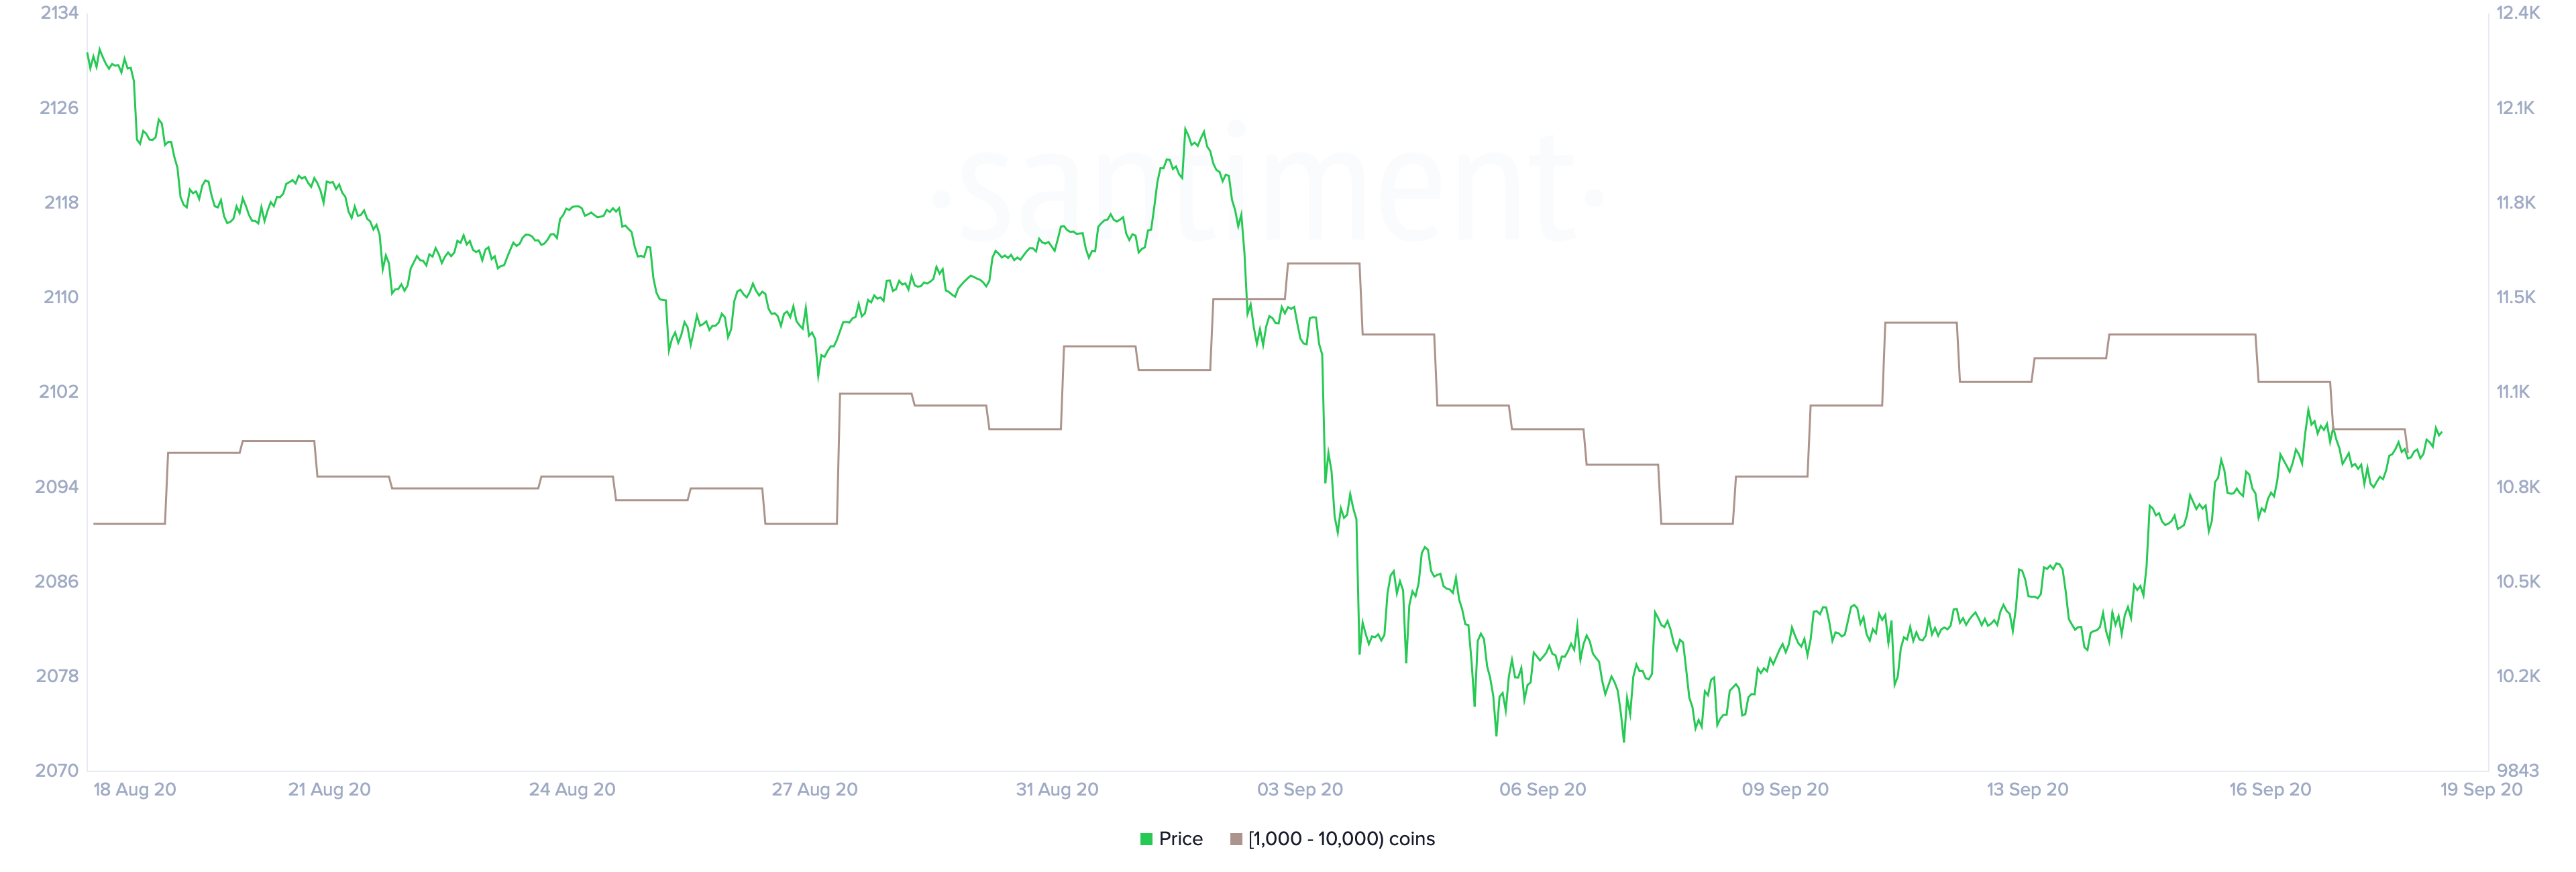
Regardless of the optimistic outlook, Santiment’s holder distribution chart reveals that large investors have taken advantage of the upward price action to realize profits. The behavior analytics firm recorded a significant decline in the number of addresses with millions of dollars in Bitcoin, colloquially known as “whales.”
Signs of a Retrace Before Further Gains
Over the past week, the number of addresses holding 1,000 to 10,000 BTC dropped substantially. Roughly 11 whales have left the network or redistributed their tokens, representing a 0.5% decrease in such a short period.
The sudden downturn in the number of large investors behind Bitcoin may seem insignificant at first glance. But when considering they hold between $11 million and $110 million in BTC, the spike in selling pressure can translate into millions of dollars.
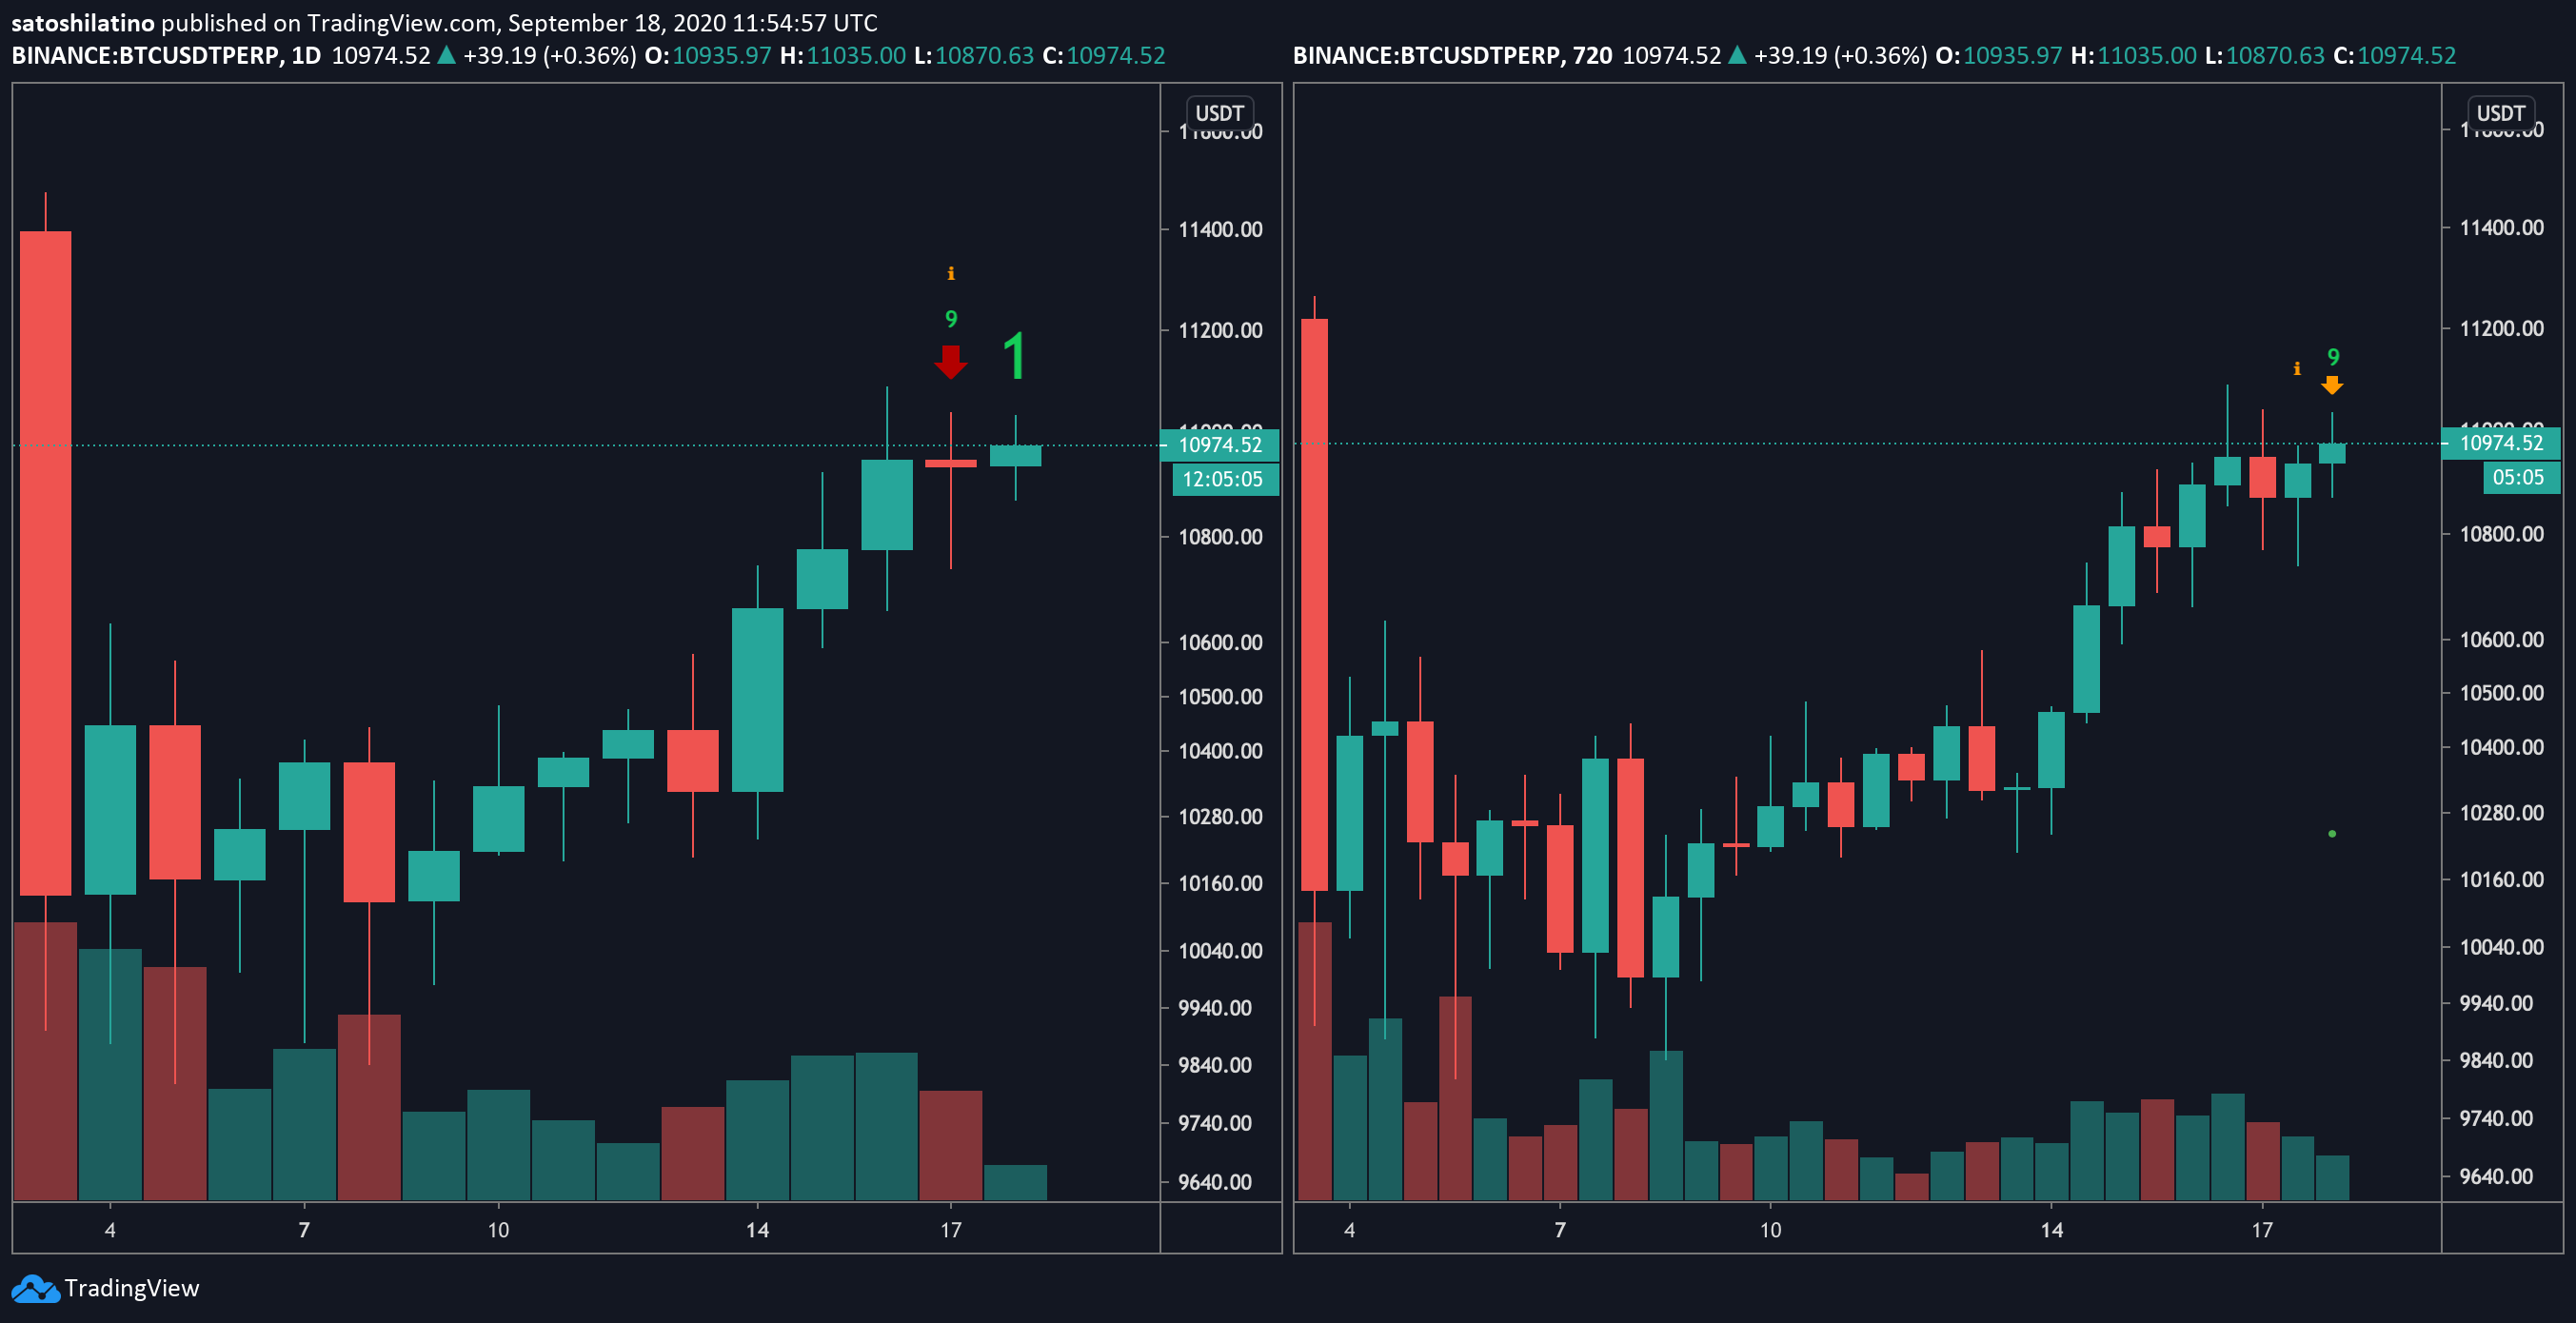
The TD sequential indicator adds credence to the probability of a potential downswing before the uptrend continues. This technical index presented sell signals in the form of a green nine candlestick on BTC’s 1-day and 12-hour chart.
The bearish formations forecast a one to four daily candlestick correction, which may see Bitcoin retest the x-axis of the ascending triangle previously mentioned.
It is worth mentioning that when assets break out of an ascending triangle, they usually retrace and retest the x-axis before surging to reach the target given by this technical formation. Therefore, a downswing towards the $10,600 may serve as an opportunity for sidelined investors to get back into the market and propel prices higher.
The IOMAP cohorts support this thesis since they show that Bitcoin sits on top of stiff support that may absorb some of the selling pressure in the event of a correction.