AXS coin price finds a boom in demand ending the consolidation and potentially bringing a trend reversal. But will buyers outshine the 50-day EMA? Key technical points:
- AXS coin price approaches the $3 mark.
- In addition, the RSI slope surpasses the 50% mark.
- The 24-hour trading volume of Axie Infinity is $360 Million, marking a 60% rise.
Past Performance of AXS
AXS coin price surpasses the long-coming resistance trendline as the buyers resurface last night at $45, resulting in a 7.53% overnight gain. The price jump concludes the consolidation range formed near the $45 mark. The price jump approaches the $50 psychological support level pushes the trend lower back to retest the bullish trendline breakout. 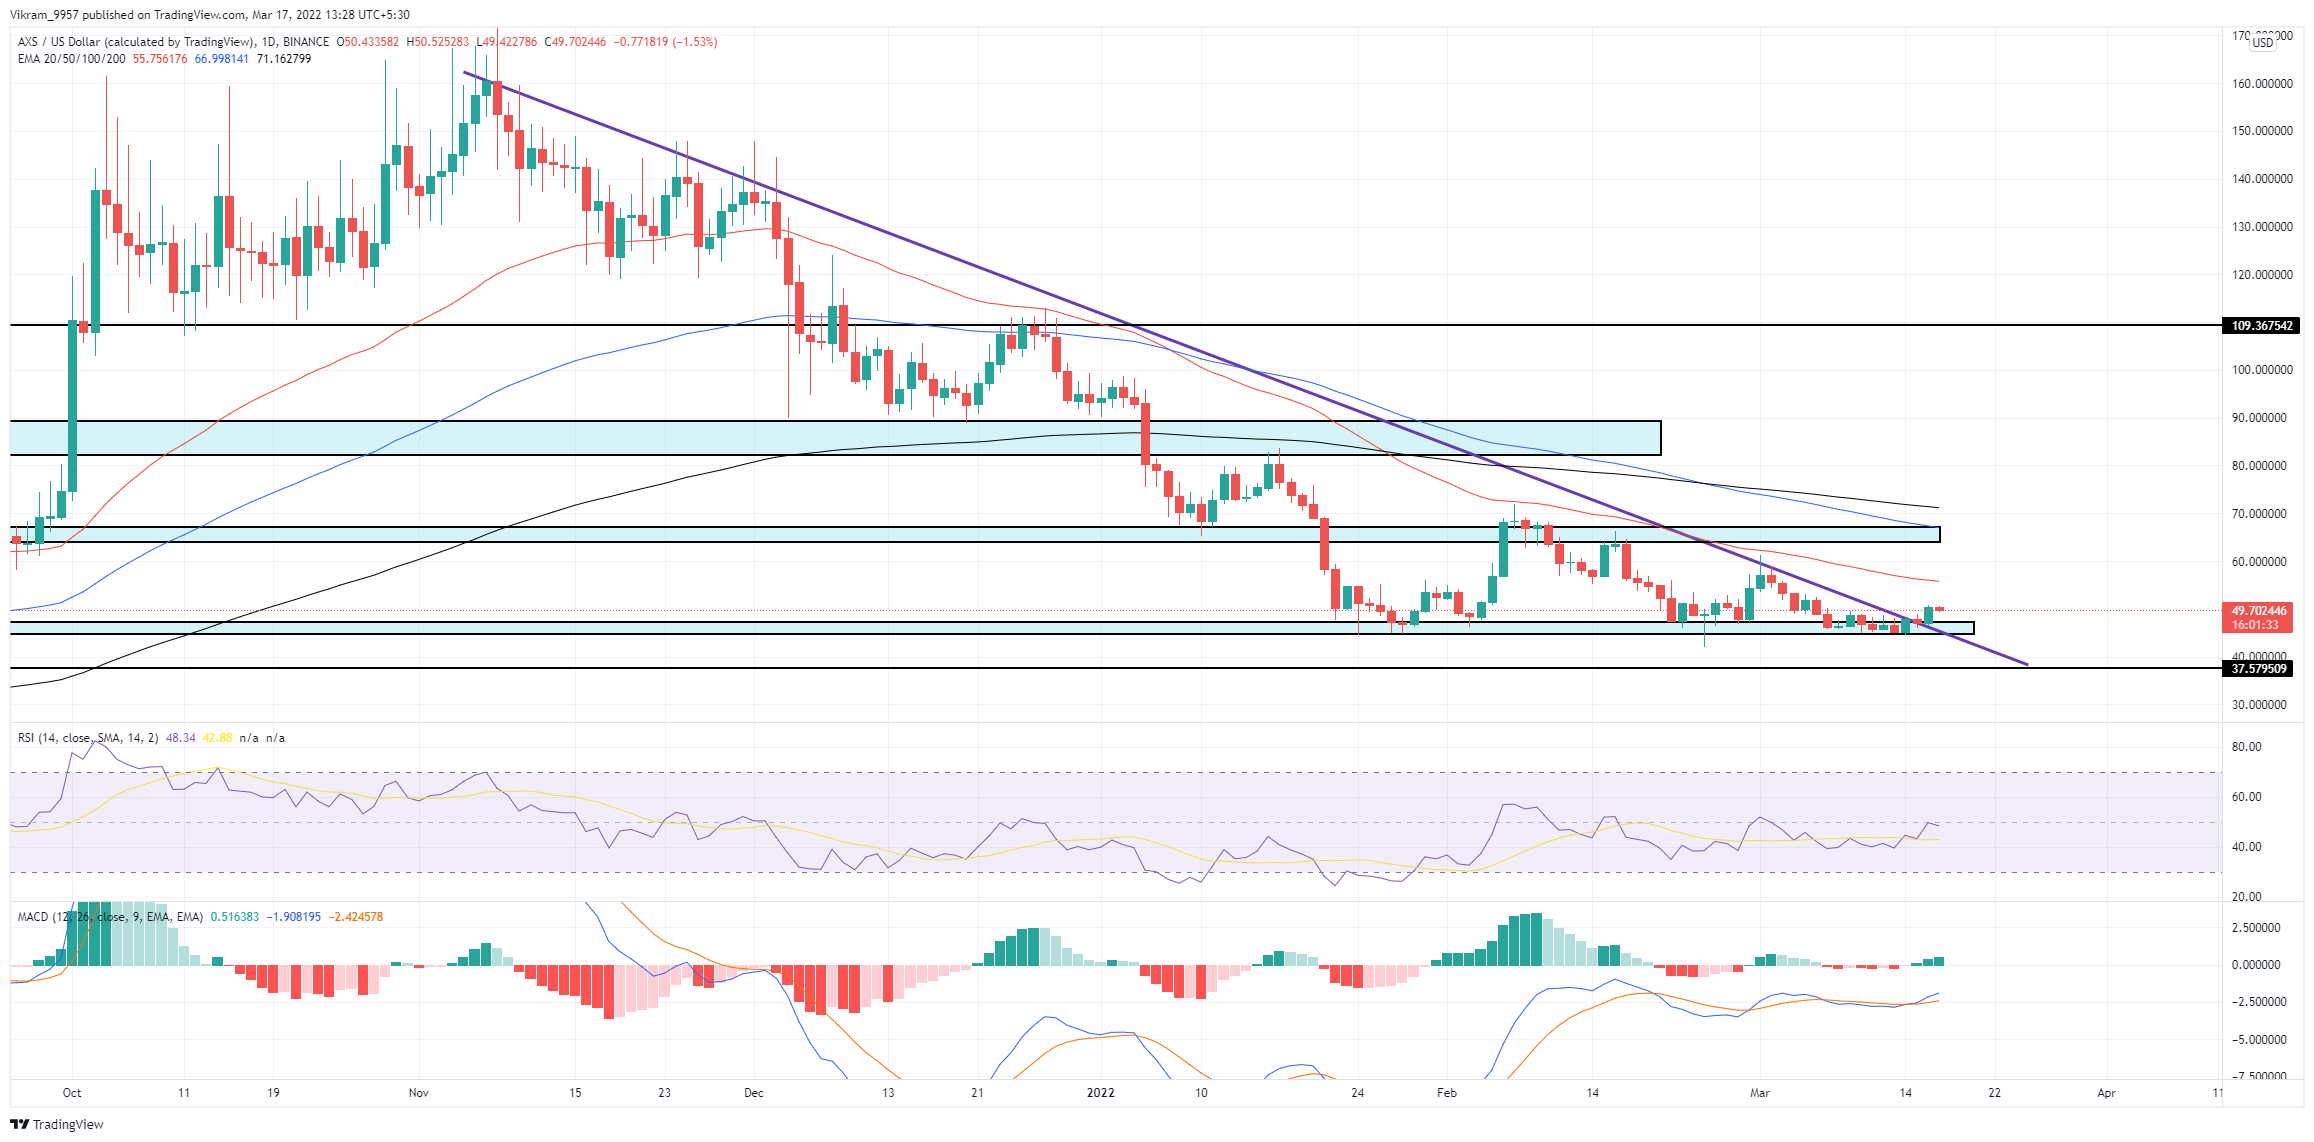 Source-Tradingview
AXS Technical Analysis
AXS coin price hints at a potential closing to the lower high formations under the resistance trendline influence. However, despite the growth in trading volume, the limited price range questions the bullish commitment. The crucial EMAs (50, 100, and 200) have achieved bearish alignment with the recent 100 and 200-day EMA crossover. Moreover, 50-day EMA has provided an emotional barrier to keep the bulls under control. Therefore, the 50-day EMA is a must for trend reversal. RSI Indicator: The RSI slope spikes above the 50% mark as the uptrend continues; meanwhile, the 14-day SMA continues the sideways trend. Nonetheless, the RSI entering the nearly overbought zone signals a bullish light. MACD Indicator: The MACD and signal lines undermine the seller's activity with the recent bullish crossover. Furthermore, the MACD histograms reflect the buyers resurfacing with the positive trend growth. In a nutshell, the AXS technical analysis forecasts a highly bullish outlook if the prices sustain above the $50 mark.
Upcoming Trend
AXS coin price indicates increasing bullish engagement, which could drive the uptrend higher above the $50 mark if the retest is successful. Furthermore, the upcoming trend could reach the $65 mark if bulls maintain the grip over trend control. However, a failed retest due to a surge in selling pressure could result in a price fall to the $45 mark. Support Levels: $47.65 and $45 Resistance Levels: $50 and $65